regional well-being in oecd countries: slovak republic
advertisement

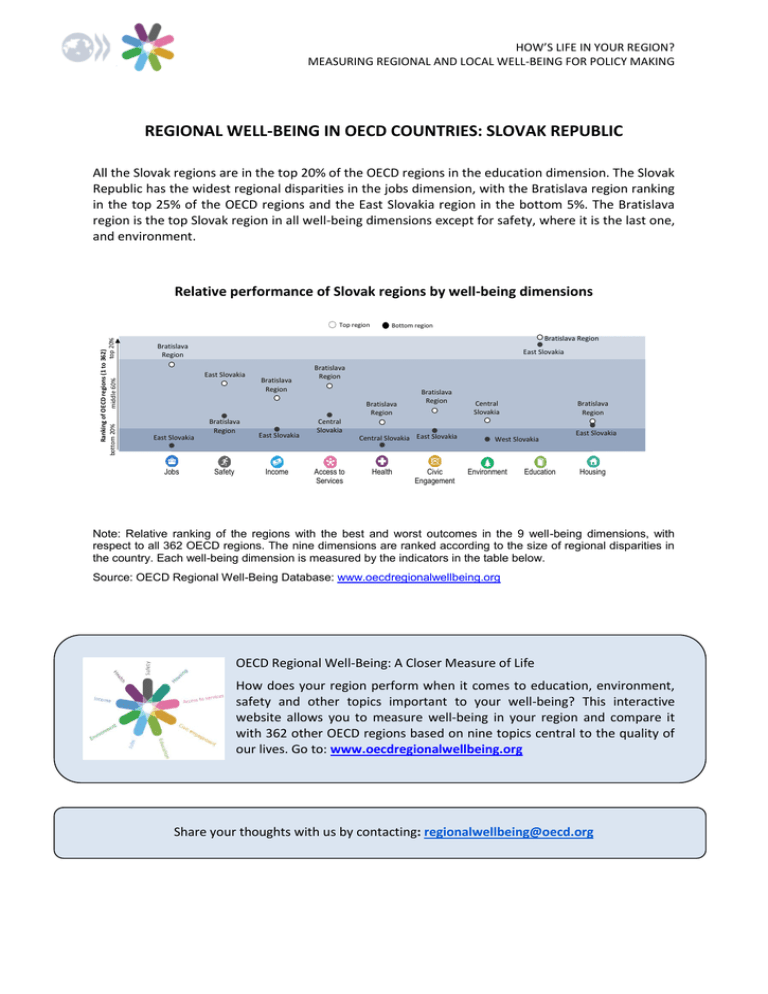
HOW’S LIFE IN YOUR REGION? MEASURING REGIONAL AND LOCAL WELL-BEING FOR POLICY MAKING REGIONAL WELL-BEING IN OECD COUNTRIES: SLOVAK REPUBLIC All the Slovak regions are in the top 20% of the OECD regions in the education dimension. The Slovak Republic has the widest regional disparities in the jobs dimension, with the Bratislava region ranking in the top 25% of the OECD regions and the East Slovakia region in the bottom 5%. The Bratislava region is the top Slovak region in all well-being dimensions except for safety, where it is the last one, and environment. Relative performance of Slovak regions by well-being dimensions Ranking of OECD regions (1 to 362) top 20% bottom 20% middle 60% Top region Bottom region Bratislava Region Bratislava Region East Slovakia East Slovakia Bratislava Region Bratislava Region Bratislava Region East Slovakia Jobs Bratislava Region Safety East Slovakia Income Central Slovakia Access to Services Bratislava Region Central Slovakia East Slovakia Health Civic Engagement Central Slovakia Bratislava Region West Slovakia Environment Education East Slovakia Housing Note: Relative ranking of the regions with the best and worst outcomes in the 9 well-being dimensions, with respect to all 362 OECD regions. The nine dimensions are ranked according to the size of regional disparities in the country. Each well-being dimension is measured by the indicators in the table below. Source: OECD Regional Well-Being Database: www.oecdregionalwellbeing.org OECD Regional Well-Being: A Closer Measure of Life How does your region perform when it comes to education, environment, safety and other topics important to your well-being? This interactive website allows you to measure well-being in your region and compare it with 362 other OECD regions based on nine topics central to the quality of our lives. Go to: www.oecdregionalwellbeing.org Share your thoughts with us by contacting: regionalwellbeing@oecd.org How do the top and bottom regions in the Slovak Republic fare on the wellbeing indicators? The high performing Slovak regions fare better than the OECD average in 5 out of the 11 well-being indicators: employment and unemployment rates, homicide rate, households with broadband access and labour force with at least a secondary degree. In the low performing regions, household disposable per capita income is around USD 8 500 half the value in the high performing regions. Slovak Regions Top 20% Bottom 20% Jobs Employment rate (%), 2013 Unemployment rate (%), 2013 Safety Homicide Rate (per 100 000 people), 2012 Income Household disposable income per capita (in USD), 2011 Access to Services Households with broadband access (%), 2013 Health Life Expectancy at birth (years), 2012 Age adjusted mortality rate (per 1 000 people), 2012 Civic Engagement Voters in last national election (%), 2013 Environment Level of air pollution (PM 2.5) experienced by regional population (µg/m³), 2012 Education Labour force with at least a secondary degree (%), 2013 Housing Rooms per person, 2012 Country Average OECD Average 72.3 6.0 54.3 18.7 59.9 13.9 66.7 8.0 1.2 2.5 1.7 4.2 15 643 8 571 10 215 18 907 69.7 61.0 65.7 67.2 77.6 75.6 76.0 79.5 10.4 11.9 11.6 8.1 62.1 55.4 59.1 67.7 15.5 19.0 17.5 12.3 96.2 92.0 94.2 74.6 1.2 1.1 1.2 1.8 Note: Data in the first two columns refer to average values in regions at the top and the bottom 20% of national ranking. OECD average is computed for 34 countries except for housing (32 countries) and life expectancy at birth (33 countries). Source: OECD Regional Well-Being Database: www.oecdregionalwellbeing.org; Our day-to-day experience of life is essentially local. Whether people can find a job, a good school for their children or adequate healthcare depends on where they live. The OECD 2014 book How’s Life in Your Region? provides a wide range of measures of social progress in OECD regions and strengthens discussion of how to improve the lives of current and future generations. Go to: e-book. For more information, please visit: http://www.oecd.org/regional/how-is-lifein-your-region.htm

