PPAI
2015 Annual Distributor Sales Summary
PPAI has researched and released industry sales data since 1965. This annual distributor sales study is considered the most definitive and comprehensive of its kind in the
industry based on actual sales reported by U.S. promotional consultant companies. The information is used primarily to measure industry growth and to convey to prospective buyers of promotional products the magnitude of the industry and the wide acceptance of the products it produces and sells. In 2015, the survey was conducted by
Relevant Insights LLC, an independent market research, on behalf of PPAI. Methodology and detailed findings can be reviewed in the full report at ppai.org/research.
Distributor
Company Size
Number Of Distributor Companies
Less than $2.5 million
22,153
$2.5 million or more
INDUSTRY TOTAL
2015 Sales
Volume
% Increase/Decrease In
Sales Volume Over 2014
$9,256,371,349
-6.63%
868
$11,551,799,373 +14.05%
23,021
$20,808,170,722 +3.82%
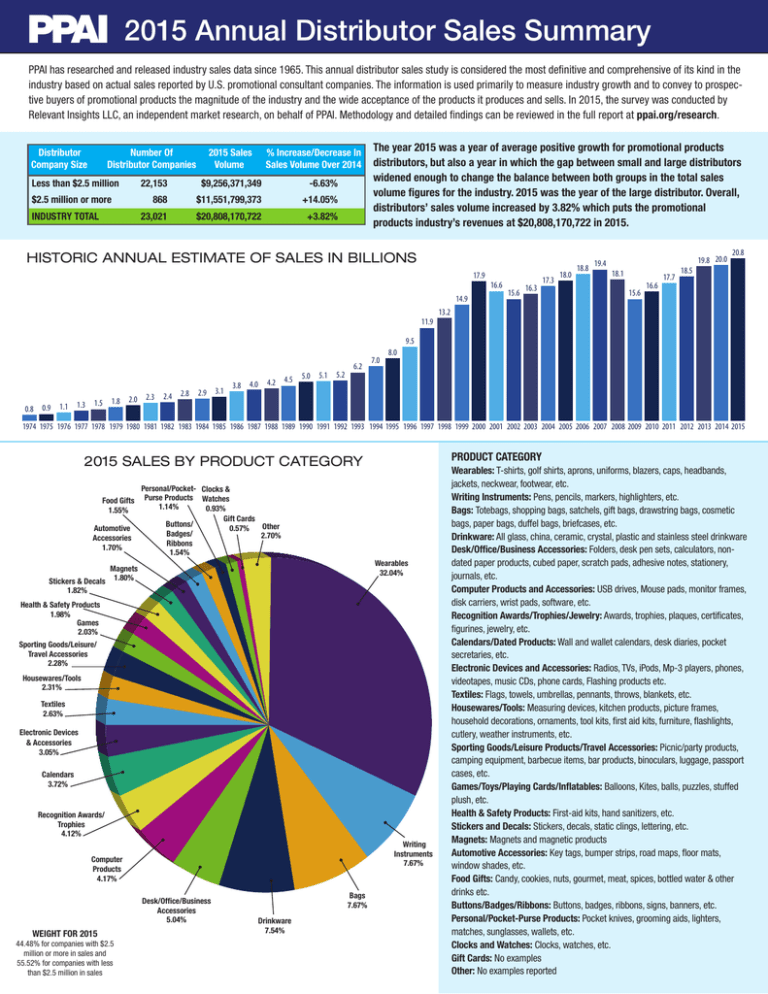
The year 2015 was a year of average positive growth for promotional products
distributors, but also a year in which the gap between small and large distributors
widened enough to change the balance between both groups in the total sales
volume figures for the industry. 2015 was the year of the large distributor. Overall,
distributors’ sales volume increased by 3.82% which puts the promotional
products industry’s revenues at $20,808,170,722 in 2015.
HISTORIC ANNUAL ESTIMATE OF SALES IN BILLIONS
17.9
14.9
11.9
16.6
15.6
16.3
17.3
18.0
18.8
19.4
18.1
15.6
16.6
17.7
18.5
19.8 20.0
20.8
13.2
9.5
0.8 0.9
1.1
1.3
1.5
1.8
2.0 2.3
2.4 2.8
2.9 3.1
3.8 4.0
4.2 4.5
5.0 5.1
5.2
6.2
7.0
8.0
1974 1975 1976 1977 1978 1979 1980 1981 1982 1983 1984 1985 1986 1987 1988 1989 1990 1991 1992 1993 1994 1995 1996 1997 1998 1999 2000 2001 2002 2003 2004 2005 2006 2007 2008 2009 2010 2011 2012 2013 2014 2015
PRODUCT CATEGORY
2015 SALES BY PRODUCT CATEGORY
Personal/Pocket- Clocks &
Food Gifts Purse Products Watches
1.14%
0.93%
1.55%
Gift Cards
Buttons/
Other
Automotive
0.57%
Badges/
2.70%
Accessories
Ribbons
1.70%
1.54%
Wearables
32.04%
Magnets
Stickers & Decals 1.80%
1.82%
Health & Safety Products
1.98%
Games
2.03%
Sporting Goods/Leisure/
Travel Accessories
2.28%
Housewares/Tools
2.31%
Textiles
2.63%
Electronic Devices
& Accessories
3.05%
Calendars
3.72%
Recognition Awards/
Trophies
4.12%
Writing
Instruments
7.67%
Computer
Products
4.17%
Desk/Office/Business
Accessories
5.04%
WEIGHT FOR 2015
44.48% for companies with $2.5
million or more in sales and
55.52% for companies with less
than $2.5 million in sales
Bags
7.67%
Drinkware
7.54%
Wearables: T-shirts, golf shirts, aprons, uniforms, blazers, caps, headbands,
jackets, neckwear, footwear, etc.
Writing Instruments: Pens, pencils, markers, highlighters, etc.
Bags: Totebags, shopping bags, satchels, gift bags, drawstring bags, cosmetic
bags, paper bags, duffel bags, briefcases, etc.
Drinkware: All glass, china, ceramic, crystal, plastic and stainless steel drinkware
Desk/Office/Business Accessories: Folders, desk pen sets, calculators, nondated paper products, cubed paper, scratch pads, adhesive notes, stationery,
journals, etc.
Computer Products and Accessories: USB drives, Mouse pads, monitor frames,
disk carriers, wrist pads, software, etc.
Recognition Awards/Trophies/Jewelry: Awards, trophies, plaques, certificates,
figurines, jewelry, etc.
Calendars/Dated Products: Wall and wallet calendars, desk diaries, pocket
secretaries, etc.
Electronic Devices and Accessories: Radios, TVs, iPods, Mp-3 players, phones,
videotapes, music CDs, phone cards, Flashing products etc.
Textiles: Flags, towels, umbrellas, pennants, throws, blankets, etc.
Housewares/Tools: Measuring devices, kitchen products, picture frames,
household decorations, ornaments, tool kits, first aid kits, furniture, flashlights,
cutlery, weather instruments, etc.
Sporting Goods/Leisure Products/Travel Accessories: Picnic/party products,
camping equipment, barbecue items, bar products, binoculars, luggage, passport
cases, etc.
Games/Toys/Playing Cards/Inflatables: Balloons, Kites, balls, puzzles, stuffed
plush, etc.
Health & Safety Products: First-aid kits, hand sanitizers, etc.
Stickers and Decals: Stickers, decals, static clings, lettering, etc.
Magnets: Magnets and magnetic products
Automotive Accessories: Key tags, bumper strips, road maps, floor mats,
window shades, etc.
Food Gifts: Candy, cookies, nuts, gourmet, meat, spices, bottled water & other
drinks etc.
Buttons/Badges/Ribbons: Buttons, badges, ribbons, signs, banners, etc.
Personal/Pocket-Purse Products: Pocket knives, grooming aids, lighters,
matches, sunglasses, wallets, etc.
Clocks and Watches: Clocks, watches, etc.
Gift Cards: No examples
Other: No examples reported
2015 SALES BY PROGRAM CATEGORY
PROGRAM TYPE
Business Gifts: Foster customer goodwill and retention
Other
1.32%
Customer
Referral
3.02%
Marketing Research
1.52%
Brand Awareness: Promotion of brand awareness and
brand loyalty
Business Gifts
13.37%
Employee Relations & Events: Morale and motivation,
corporate/employee events, employee orientation,
organizational commitment/corporate identity, corporate
communication, employee training (other than safety),
employee referral programs
Safety Education
3.62%
New Product
4.32%
Trade Shows: Trade-show traffic generation
Internal Promotions
5.63%
Brand Awareness
12.24%
Dealer/Distributor Programs: Dealer incentives, co-op
programs, company stores
New Customer/Account Generation: New customer or
new account generation
Employee
Service Awards
6.08%
Public Relations: Corporate involvement with
community, fundraising, sponsorship, school programs,
media relations, corporate image
Not-For-Profit Programs: Not-for-profit use for
fundraising, public awareness campaigns (health,
environment, public safety, etc.)
Not-For-Profit
Programs
6.22%
Employee Service Awards: Anniversary recognition,
service awards, etc.
Employee
Relations
& Events
11.95%
Public Relations
6.38%
Internal Promotions (Incentive; Non-Safety): Sales
incentive, TQM/quality programs, productivity, inventory
reduction, error reduction, attendance improvement
New Product/Service Introduction: New product or
service introduction
Safety Education/Incentive: Employee safety and
education
Trade Shows
10.32%
New Customer
6.96%
Dealer/DIstributor
Programs
7.04%
WEIGHT FOR 2015
44.48% for companies with $2.5
million or more in sales and
55.52% for companies with less
than $2.5 million in sales
Customer Referrals: Customer referral incentive
programs
Marketing Research: Marketing research, survey and
focus group participation programs
Other: No examples reported
Responses to questions about product and program categories continue to be a challenge as many distributors do not keep
track of their sales by these categories. In order to continue building on the established research, PPAI urges new entrants to the
industry and established distributors to keep track of their sales by PPAI’s product and program categories shown in this summary.
INDUSTRY SALES BY SIZE OF COMPANY
20112012201320142015
Company Size*
Change
over 2014
Less than $250,000
$1,645,603,749 $1,637,920,855
$1,673,365,807
$1,846,568,885$1,770,604,678 -4.11%
$250,001-$500,000
$1,618,544,334 $1,879,888,822
$1,509,019,388
$1,530,260,232
$500,001-$1,000,000
$2,364,147,043 $2,358,616,521
$2,482,433,936
$2,207,506,975$2,562,181,430+16.07%
$1,000,001-$2,500,000
$3,455,562,374 $3,302,693,393
$4,422,696,874
$4,329,256,589
$2,500,001 or more
$8,638,088,190 $9,318,526,638
$9,739,357,718
$10,128,636,250
TOTAL
$17,721,945,690$18,497,646,229$19,826,873,723$20,042,228,931$20,808,170,722+3.82%
$1,481,662,627-3.18%
$3,441,922,613-20.50%
$11,551,799,373+14.05%
ONLINE SALES OF PROMOTIONAL PRODUCTS
Online sales are defined as sales resulting from orders placed through an online store or website.
Company Size*
2011
2012
2013
2014
2015
Less than
$2.5 million
$1,275,870,533
$1,553,179,741
$1,075,428,815
$1,378,340,947$834,370,461
$2.5 million
or more
$1,823,500,417
$2,189,834,184
$1,621,952,603
$2,203,655,822$3,110,511,442
$3,099,370,950
$3,743,013,925
$2,697,381,418
$3,581,996,769$3,944,881,904
TOTAL
*By Sales Volume
© 2016 Promotional Products Association International. All rights reserved. Subject to change without notice. UPIC: PPAI

