Displaying data – Log scale
advertisement

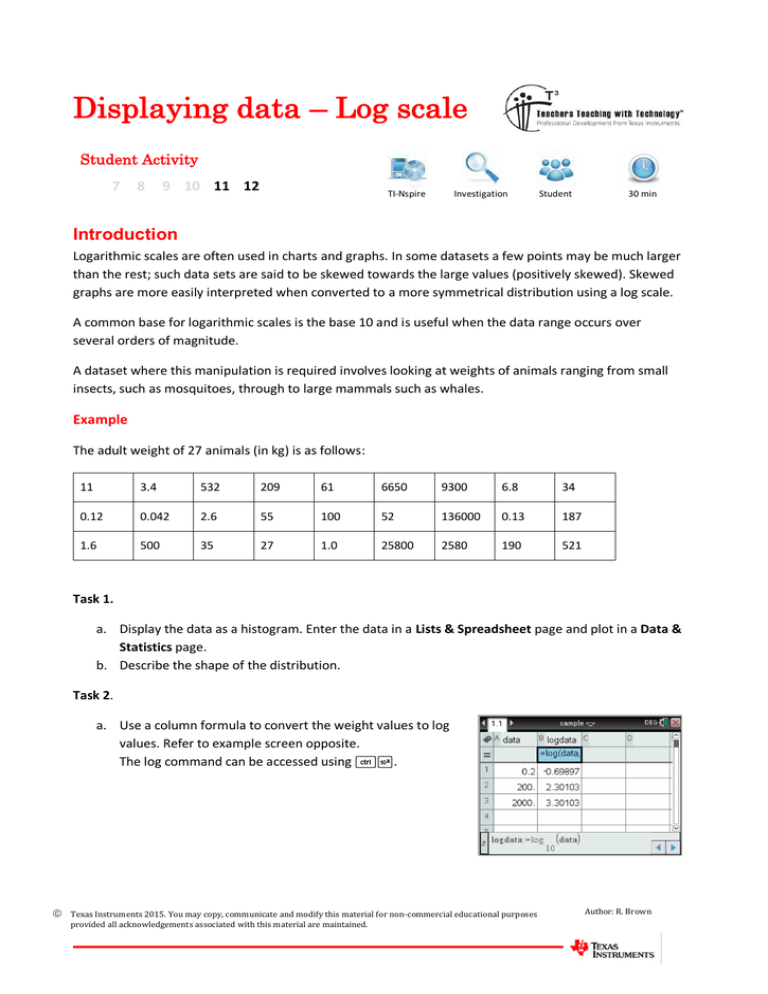
Displaying data – Log scale Student Activity 7 8 9 10 11 12 TI-Nspire Investigation Student 30 min Introduction Logarithmic scales are often used in charts and graphs. In some datasets a few points may be much larger than the rest; such data sets are said to be skewed towards the large values (positively skewed). Skewed graphs are more easily interpreted when converted to a more symmetrical distribution using a log scale. A common base for logarithmic scales is the base 10 and is useful when the data range occurs over several orders of magnitude. A dataset where this manipulation is required involves looking at weights of animals ranging from small insects, such as mosquitoes, through to large mammals such as whales. Example The adult weight of 27 animals (in kg) is as follows: 11 3.4 532 209 61 6650 9300 6.8 34 0.12 0.042 2.6 55 100 52 136000 0.13 187 1.6 500 35 27 1.0 25800 2580 190 521 Task 1. a. Display the data as a histogram. Enter the data in a Lists & Spreadsheet page and plot in a Data & Statistics page. b. Describe the shape of the distribution. Task 2. a. Use a column formula to convert the weight values to log values. Refer to example screen opposite. The log command can be accessed using /s. Texas Instruments 2015. You may copy, communicate and modify this material for non-commercial educational purposes provided all acknowledgements associated with this material are maintained. Author: R. Brown Displaying data - Log scale 2 - Student Worksheet b. Display the transformed data as a histogram with Bin Setting Width of 1 and Alignment of -2 (b>Plot Properties>Histogram Properties>Bin Settings>Equal Bin Width). Change the y-scale to Percent using b>Plot Properties>Histogram Properties>Histogram Scale>Percent c. Describe the shape and distribution of the histogram. d. What percentage of animals in the dataset had weights between 10 and 100 kg? Scroll across the histogram to show column details. Hint: log 10 = 1, log 100 =2 e. Compare the number of animals weighing between 100 kg and 1000 kg with the number weighing between 10 and 100 kg. Task 3. a. Discuss why using the histogram with the log transformation was better than the original histogram in answering parts 2(d) and 2(e) above. Texas Instruments 2015. You may copy, communicate and modify this material for non-commercial educational purposes provided all acknowledgements associated with this material are maintained. Author: R. Brown


