The Sphere of Influence Graph: Theory and Applications
advertisement
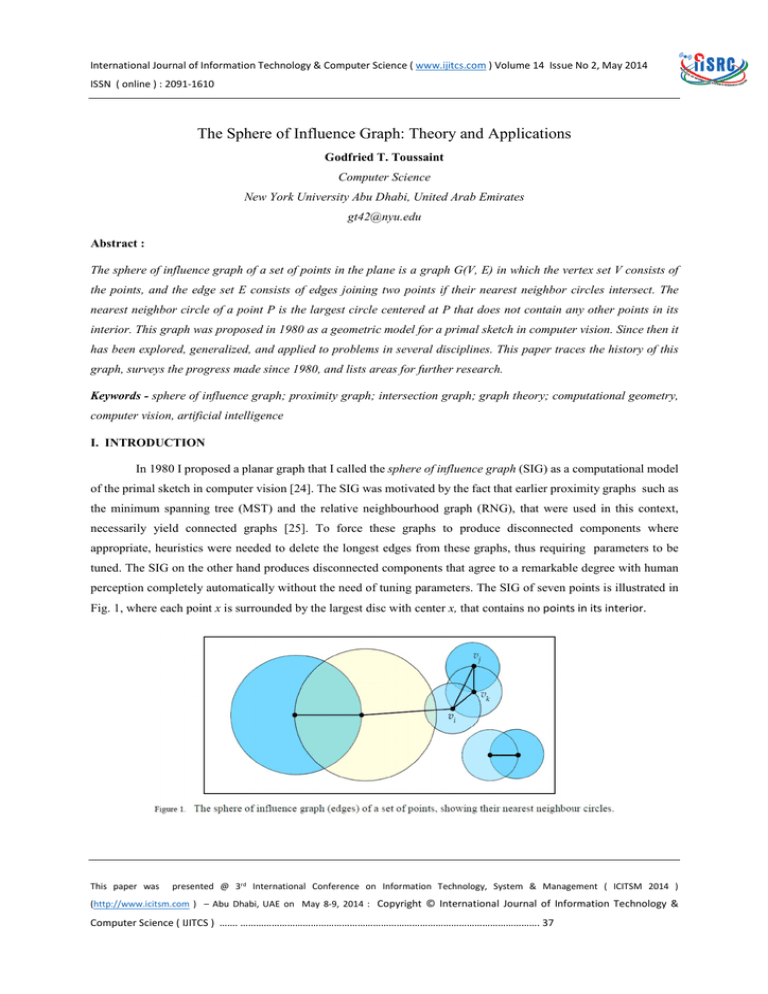
International Journal of Information Technology & Computer Science ( www.ijitcs.com ) Volume 14 Issue No 2, May 2014 ISSN ( online ) : 2091-1610 The Sphere of Influence Graph: Theory and Applications Godfried T. Toussaint Computer Science New York University Abu Dhabi, United Arab Emirates gt42@nyu.edu Abstract : The sphere of influence graph of a set of points in the plane is a graph G(V, E) in which the vertex set V consists of the points, and the edge set E consists of edges joining two points if their nearest neighbor circles intersect. The nearest neighbor circle of a point P is the largest circle centered at P that does not contain any other points in its interior. This graph was proposed in 1980 as a geometric model for a primal sketch in computer vision. Since then it has been explored, generalized, and applied to problems in several disciplines. This paper traces the history of this graph, surveys the progress made since 1980, and lists areas for further research. Keywords - sphere of influence graph; proximity graph; intersection graph; graph theory; computational geometry, computer vision, artificial intelligence I. INTRODUCTION In 1980 I proposed a planar graph that I called the sphere of influence graph (SIG) as a computational model of the primal sketch in computer vision [24]. The SIG was motivated by the fact that earlier proximity graphs such as the minimum spanning tree (MST) and the relative neighbourhood graph (RNG), that were used in this context, necessarily yield connected graphs [25]. To force these graphs to produce disconnected components where appropriate, heuristics were needed to delete the longest edges from these graphs, thus requiring parameters to be tuned. The SIG on the other hand produces disconnected components that agree to a remarkable degree with human perception completely automatically without the need of tuning parameters. The SIG of seven points is illustrated in Fig. 1, where each point x is surrounded by the largest disc with center x, that contains no points in its interior. This paper was presented @ 3rd International Conference on Information Technology, System & Management ( ICITSM 2014 ) (http://www.icitsm.com ) – Abu Dhabi, UAE on May 8-9, 2014 : Copyright © International Journal of Information Technology & Computer Science ( IJITCS ) ……. ……………………………………………………………………………………………………. 37 International Journal of Information Technology & Computer Science ( www.ijitcs.com ) Volume 14 Issue No 2, May 2014 ISSN ( online ) : 2091-1610 For any point vi in Fig. 1, the radius of its corresponding disc is determined by the nearest neighbor of vi. The SIG contains an edge between vertices vi and vj if, and only if, the discs associated with vi and vj intersect. The SIG in the example of Fig. 1 contains two disconnected components, and one cycle between vertices vi, vk, and vj. The example in Fig. 1 is a plane graph, but examples may be constructed in which the SIG contains complete subgraphs (cliques) that contain crossing edges. Thus the SIG need not be a plane graph. Since 1980 the SIG has been explored from the computational geometry and graph theory points of view, it has been generalized in several ways, and it has found use in several applications. This paper traces the history and progress made on this graph and its generalizations, and lists open problems for further research. II. THEORY A. The Size of the Sphere of Influence Graph Although the SIG in the plane contains sub-graphs that are cliques [15], I observed that the cliques could not be very large, which led me to conjecture in 1980 that for n points in the plane the number of edges in their SIG was O(n). Shortly after, in 1982, Avis and Horton [1] proved that the SIG of n points in the plane has at most 29n edges, and that every decision tree algorithm for computing a SIG requires at least Ω(n log n) steps in the worst case. Hossam ElGindy, one of our graduate students at McGill University at that time, pointed out that with existing computational geometry techniques the SIG could be computed in O(n log n) time, thus matching the lower bound [1]. Soss showed that a result obtained independently by Reifenberg [18] and Bateman and Erdős [2] could be used to show that the SIG has at most 18n edges. Michael and Quint [MQ-1994] reduced this upper bound to 17.5n, and Soss sharpened this upper bound to 15n [21]. David Avis conjectured that a tight upper bound is 9n [21]. Soss also obtained bounds on the size of the open sphere of influence graph in L∞ metric spaces [20]. Guibas, Pach, and Sharir [7] showed that for fixed dimensions the number of edges in the SIG remains O(n). Palka and Sperling [16] consider the SIG of a set of points generated by a Poisson random process on the real line. They determine the expected number and variance of connected components (clusters) formed by sets of n points. Another interesting property of random SIGs is the number of vertices of degree one. Sperling determines the expected value and variance of this number for SIGs in ddimensional spaces for d ≥ 2 [19]. A natural way to construct a random SIG is to generate the points uniformly on the unit hypersphere or in a unit hypercube. For the hypersphere Dwyer [5] found upper and lower bounds on the expected number of edges in a random SIG. Since then asymptotically exact values for the expected number of edges in random SIGs for points in the unit hypercube have been determined for all values of d [4]. See also the papers of Furedi [6] and Hitczenko, Janson, and Yukich [9]. Related to the problem of cliques in SIGs is that of determining which complete graphs are SIGs. It is known that K8 is a SIG [28], and it was shown by Kézdy and Kubicki [27], that K(12) is not a closed SIG. B. Generalizations of the Sphere of Influence Graph The original definition of the SIG with the Euclidean distance [24] has been generalized to other metrics [3], [7], [13], [14]. Also, the original definition of a SIG that specified open balls, was modified slightly to include the boundaries of the balls, leading to the closed SIG [8]. In the context of computing the surfaces of dense clouds of This paper was presented @ 3rd International Conference on Information Technology, System & Management ( ICITSM 2014 ) (http://www.icitsm.com ) – Abu Dhabi, UAE on May 8-9, 2014 : Copyright © International Journal of Information Technology & Computer Science ( IJITCS ) ……. ……………………………………………………………………………………………………. 38 International Journal of Information Technology & Computer Science ( www.ijitcs.com ) Volume 14 Issue No 2, May 2014 ISSN ( online ) : 2091-1610 points, Klein and Zaxhmann [33] proposed the k-SIG, which constructs the balls for each point with radius determined by the point’s kth nearest neighbor. A broader generalization is the abstract SIG, which is a graph that is isomorphic to a SIG [8]. Holm and Bogart [26] generalize the SIG by assigning to each point a tolerance, and adding an edge between two points if their balls overlap by more than the sum (also minimum) of their tolerances. Lipman has introduced the maximum tolerance SIG [29]. Jacobson, Lipman, and McMorris [30], characterize trees which are open and closed SIGs, and obtain a bound on the number of edges when the SIGs are triangle-free. Their characterization of closed SIGs is succinct: a tree is a closed SIG if, and only if, it contains a perfect matching. For more on trees see [39]. McMorris and Wang [35] proposed a variant of the SIG, which they called the sphere-of-attraction graph (SAG). In this generalization the points are divided into two sets C and P, which may be viewed, respectively, as customers and products, and the ball for each point in C has a radius equal to the closest point in P. In the SAG an edge is inserted connecting two pints in C if their balls intersect. III. APPLICATIONS The main area of application for SIGs is in low-level computer vision [12], [17] cluster analysis [10], pattern recognition [23], geographic information systems [37], modeling visual illusions [23], and streaming processes in music perception [22]. For some of these applications it is useful to know which graphs are SIGs of sets of pixels in an image. In this context Lipman [11] shows that every SIG has a realization as a set of points with integer coordinates. One weakness of the SIG in some applications, where a connected shape structure must be extracted from a dot pattern, is evident when there are pairs of points closer to each other than to the rest of the set. In such circumstances these pairs will be connected to each other but not to the remaining points. Klein and Zachmann [33] propose several extensions of the SIG to handle such problems. One of their extensions constructs balls with radius greater than that determined by the nearest neighbor. The sphere-of-attraction graph proposed by McMorris and Wang [35] has applications to marketing [28]. IV. CONCLUSION AND OPEN PROBLEMS A natural family of open problems concerns sharpening the bounds on the number of edges in a SIG. For example, it is not known whether the complete graphs K9, K10, or K11 are SIGs. Soss showed that the Euclidean open SIG has at most 15n edges. Can this bound be improved to 9n? Another area where the exploration of the SIG can make a contribution is in the visualization of large graphs or networks, by computing the SIG of the graph, and rendering the SIG instead of the large graph, as has been done with other proximity graphs [38]. Algorithms for computing the SIG of a prescribed graph already exist [31], [32]. Computing the SIG of social networks [34] could also provide a useful tool for analyzing “social cartography” [36] processes such as citation networks, commercial networks and marketing, customer relations, and the spreading of diseases. ACKNOWLEDGMENT This research was supported by a grant from the Provost's Office of New York University Abu Dhabi, through the Faculty of Science, in Abu Dhabi, The United Arab Emirates. This paper was presented @ 3rd International Conference on Information Technology, System & Management ( ICITSM 2014 ) (http://www.icitsm.com ) – Abu Dhabi, UAE on May 8-9, 2014 : Copyright © International Journal of Information Technology & Computer Science ( IJITCS ) ……. ……………………………………………………………………………………………………. 39 International Journal of Information Technology & Computer Science ( www.ijitcs.com ) Volume 14 Issue No 2, May 2014 ISSN ( online ) : 2091-1610 REFERENCES 1. D. Avis, and J. Horton, “Remarks on the sphere of influence graph,” Discrete Geometry and Convexity (New York, 1982), pp. 323-327, Ann. New York Acad. Sci., 440, New York Acad. Sci., New York, 1985. 2. P. Bateman, and P. Erdős, “Geometrical extrema suggested by a lemma of Besicovitch,” American Mathematical Monthly, vol. 58, no. 5, pp. 306-314, 1951. 3. E. Boyer, L. Lister, and B. Shader, “Sphere-of-influence graphs using the sup-norm,” Mathematical and Computer Modelling, vol. 32, pp. 1071-1082, 2000. 4. T. Chalker, A. Godbole, P. Hitczenko, J. Radcliff, and O. Ruehr, “On the size of a random sphere of influence graph,” Advances in Applied Probability, vol. 31, pp. 596-609, 1999. 5. R. A. Dwyer, “The expected size of the sphere-of-influence graph,” Computational Geometry: Theory and Applications, vol. 5, pp. 155-164, 1995. 6. Z. Furedi, “The expected size of a random sphere of influence graph,” Intuitive Geometry, Bolyai Math. Soc., vol. 6, 319-326, 1995. 7. L. Guibas, J. Pach, and M. Sharir, “Sphere of influence graphs in higher dimensions,” Proc. Coll. Math. Soc. J. Bolyai, vol. 63, 131-137, 1994. 8. F. Harary, M. S. Jacobson, M. J. Lipman, and F. R. McMorris, “Abstract sphere-of-influence graphs,” Mathematical and Computer Modelling, vol. 17, no. 11, pp. 77-83, 1993. 9. P. Hitczenko, S. Janson, and J.E. Yukich, “On the variance of the random sphere of influence graph,” Random Structures and Algorithms, vol. 14, pp. 139-152, 1999. 10. J. W. Jaromczyk, and G. T. Toussaint, “Relative neighborhood graphs and their relatives,” Proceedings of the IEEE, vol. 80, no. 9, pp. 1502-1517, September 1992. 11. M. J. Lipman, “Integer realizations of sphere-of-influence graphs,” Congressus Numerantium, vol. 91, pp. 63-70, 1992. 12. D. Marr, “Early processing of visual information,” Philosophical Transactions Royal Society of London B, vol. 275, pp. 83-524, 1976. 13. T. S. Michael, and T. Quint, “Sphere of influence graphs and the L∞ metric,” Discrete Applied Mathematics, vol. 127, pp. 447-460, 2003. 14. T. S. Michael, and T. Quint, “Sphere of influence graphs in general metric spaces,” Mathematical and Computer Modelling, vol. 29, pp. 45-53, 1999. 15. T. S. Michael, and T. Quint, “Sphere of influence graphs: Edge density and clique size,” Mathematical and Computer Modelling, vol. 20, no. 7, pp. 19-24, 1994. 16. S. Palka, and M. Sperling, “On a sphere of influence graph in a one-dimensional space,” Discussiones Mathematicae, Graph Theory, vol. 25, pp. 427-433, 2005. 17. T. Poggio, “Marr’s computational approach to vision,” Neurosciences, vol. 4, no. 10, pp. 258-262, 1981. 18. E. R. Reifenberg, “A problem on circles,” Mathematical Gazette, vol. 32, pp. 290-292, 1948. This paper was presented @ 3rd International Conference on Information Technology, System & Management ( ICITSM 2014 ) (http://www.icitsm.com ) – Abu Dhabi, UAE on May 8-9, 2014 : Copyright © International Journal of Information Technology & Computer Science ( IJITCS ) ……. ……………………………………………………………………………………………………. 40 International Journal of Information Technology & Computer Science ( www.ijitcs.com ) Volume 14 Issue No 2, May 2014 ISSN ( online ) : 2091-1610 19. M. Sperling, “Vertices of degree one in a random sphere of influence graph,” Probability and Mathematical Statistics, vol. 20, no. 2, pp. 391-397, 2000. 20. M. Soss, “On the size of the Euclidean sphere of influence graph,” Proceedings of the Eleventh Canadian Conference on Computational Geometry, Vancouver, Canada, August 1999. 21. M. Soss, “The size of the open sphere of influence graph in L∞ metric spaces,” Proceedings of the Tenth Canadian Conference on Computational Geometry, Montreal, Canada, August 1998. 22. G. T. Toussaint, The Geometry of Musical Rhythm: What Makes a “Good” Rhythm Good? Chapman & Hall/CRC Press, Boca Raton: 2013. 23. G. T. Toussaint, “A graph-theoretical primal sketch,” in Computational Morphology, G. T. Toussaint, Ed., NorthHolland, Amsterdam, 1988, pp. 229-260. 24. G. T. Toussaint, “Pattern recognition and geometrical complexity,” Proceedings Fifth International Conference on Pattern Recognition, Miami Beach, December 1980, pp. 1324-1347. 25. G. T. Toussaint, “The relative neighborhood graph of a finite planar set,” Pattern Recognition, vol. 12, pp. 261268, 1980. 26. T. S. Holm, and K. P. Bogart, “On tolerance sphere-of-influence graphs,” Bulletin of the Institute of Combinatorics and its Applications, vol. 24, pp. 33-46, 1998. 27. A. E. Kézdy, and G. Kubicki, “K(12) is not a closed sphere-of-influence graph,” Intuitive geometry (Budapest, 1995), 383--397, Bolyai Soc. Math. Stud., 6, János Bolyai Math. Soc., Budapest, 1997. 28. T. A. McKee, and F. R. McMorris, Intersection Graph Theory, Monographs on Discrete Mathematics and Applications (Book 2), Society for Industrial and Applied Mathematics (February 1999). 29. M. Lipman, “Maximum tolerance sphere-of-influence graphs,” Congressus Numerantium, vol. 121, pp. 195-203, 1996. 30. M. S. Jacobson, M. J. Lipman, and F. R. McMorris, “Trees that are sphere-of-influence graphs,” Applied Mathematics Letters, vol. 8, no. 6, pp. 89-93, 1995. 31. F. Harary, M. S. Jacobson, M. J. Lipman, and F. R. McMorris, “Sphere of influence graphs defined on a prescribed graph,” International Conference on Graphs and Hypergraphs (Varenna, 1991), Journal of Combinatorics, Information & System Sciences, vol. 19, pp. 1-2, 5-10, 1994). 32. G. Chen, R. J. Gould, M. S. Jacobson, R. H. Schelp, and D. A. West, “A characterization of influence graphs of a prescribed graph,” Vishwa International Journal of Graph Theory, vol. 1, no. 1, pp. 77-81, 1992. 33. J. Klein, and G. Zachmann, “Point cloud surfaces using geometric proximity graphs,” Computers & Graphics, vol. 28, pp. 839-850, 2004. 34. D. Loshin, and A. Reifer, “Connectivity and spheres of influence,” in Using Information to Develop a Culture of Customer Centricity, Morgan Kaufmann, 2013, Chapter 5, pp. 32-38. 35. F. R. McMorris, and C. Wang, “Sphere-of-attraction graphs,” Congressus Numerantium, vol. 142, pp. 149- 160, 2000. 36. J. H. Levine, “The sphere of influence,” American Sociological Review, vol. 37, no. 1, pp. 14-27, 1972. This paper was presented @ 3rd International Conference on Information Technology, System & Management ( ICITSM 2014 ) (http://www.icitsm.com ) – Abu Dhabi, UAE on May 8-9, 2014 : Copyright © International Journal of Information Technology & Computer Science ( IJITCS ) ……. ……………………………………………………………………………………………………. 41 International Journal of Information Technology & Computer Science ( www.ijitcs.com ) Volume 14 Issue No 2, May 2014 ISSN ( online ) : 2091-1610 37. R. S. Bivand, “Creating neighbours,” vignette from: R. S. Bivand, E. Pebesma, and V. Gómez-Rubio, Applied Spatial Data Analysis, Springer-Verlag, New York, 2008, pp. 239-251. 38. B. M. Ábrego, R. Fabila-Monroy, S. Fernández-Merchand, D. Flores-Peñaloza, F. Hurtado, H. Meijer, V. Sacristán, and M. Saumell, “Proximity graphs inside large weighted graphs,” Networks, vol. 61, no. 1, pp. 29-39, 2013. 39. L. Sunil Chandran, R. Chitnis, and R. Kumar, “On the SIG-dimension of trees under the L∞-metric,” Graph and Combinatorics, vol. 29, pp. 773-794, 2013. This paper was presented @ 3rd International Conference on Information Technology, System & Management ( ICITSM 2014 ) (http://www.icitsm.com ) – Abu Dhabi, UAE on May 8-9, 2014 : Copyright © International Journal of Information Technology & Computer Science ( IJITCS ) ……. ……………………………………………………………………………………………………. 42
