TEKS Based Lesson Plan
advertisement
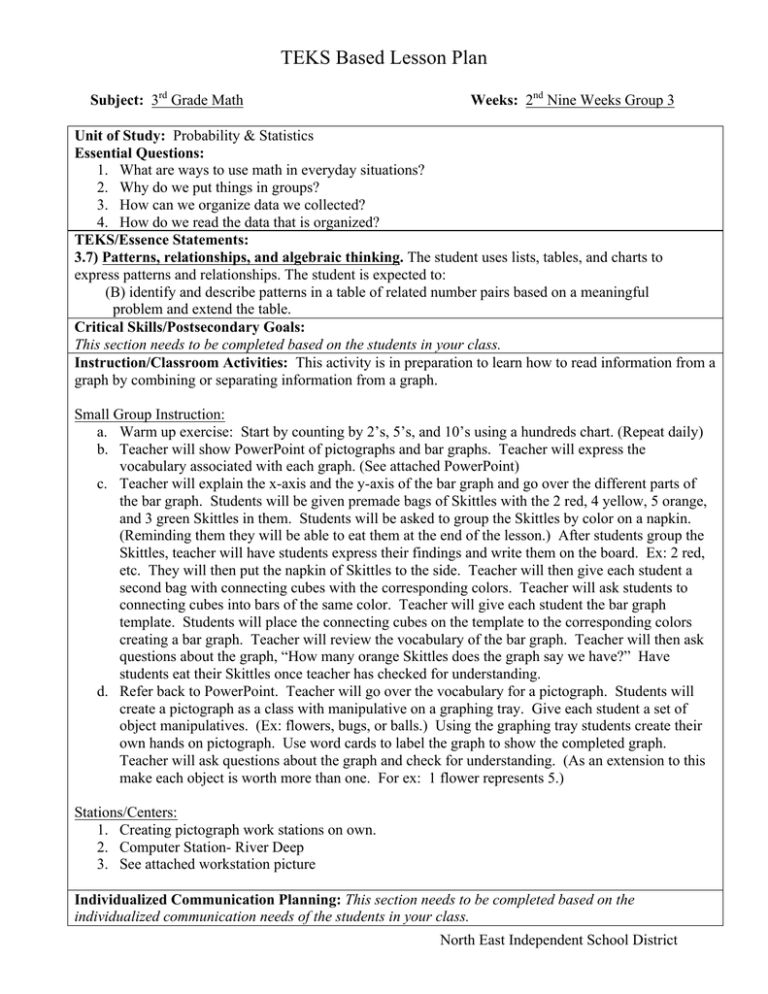
TEKS Based Lesson Plan Subject: 3rd Grade Math Weeks: 2nd Nine Weeks Group 3 Unit of Study: Probability & Statistics Essential Questions: 1. What are ways to use math in everyday situations? 2. Why do we put things in groups? 3. How can we organize data we collected? 4. How do we read the data that is organized? TEKS/Essence Statements: 3.7) Patterns, relationships, and algebraic thinking. The student uses lists, tables, and charts to express patterns and relationships. The student is expected to: (B) identify and describe patterns in a table of related number pairs based on a meaningful problem and extend the table. Critical Skills/Postsecondary Goals: This section needs to be completed based on the students in your class. Instruction/Classroom Activities: This activity is in preparation to learn how to read information from a graph by combining or separating information from a graph. Small Group Instruction: a. Warm up exercise: Start by counting by 2’s, 5’s, and 10’s using a hundreds chart. (Repeat daily) b. Teacher will show PowerPoint of pictographs and bar graphs. Teacher will express the vocabulary associated with each graph. (See attached PowerPoint) c. Teacher will explain the x-axis and the y-axis of the bar graph and go over the different parts of the bar graph. Students will be given premade bags of Skittles with the 2 red, 4 yellow, 5 orange, and 3 green Skittles in them. Students will be asked to group the Skittles by color on a napkin. (Reminding them they will be able to eat them at the end of the lesson.) After students group the Skittles, teacher will have students express their findings and write them on the board. Ex: 2 red, etc. They will then put the napkin of Skittles to the side. Teacher will then give each student a second bag with connecting cubes with the corresponding colors. Teacher will ask students to connecting cubes into bars of the same color. Teacher will give each student the bar graph template. Students will place the connecting cubes on the template to the corresponding colors creating a bar graph. Teacher will review the vocabulary of the bar graph. Teacher will then ask questions about the graph, “How many orange Skittles does the graph say we have?” Have students eat their Skittles once teacher has checked for understanding. d. Refer back to PowerPoint. Teacher will go over the vocabulary for a pictograph. Students will create a pictograph as a class with manipulative on a graphing tray. Give each student a set of object manipulatives. (Ex: flowers, bugs, or balls.) Using the graphing tray students create their own hands on pictograph. Use word cards to label the graph to show the completed graph. Teacher will ask questions about the graph and check for understanding. (As an extension to this make each object is worth more than one. For ex: 1 flower represents 5.) Stations/Centers: 1. Creating pictograph work stations on own. 2. Computer Station- River Deep 3. See attached workstation picture Individualized Communication Planning: This section needs to be completed based on the individualized communication needs of the students in your class. North East Independent School District TEKS Based Lesson Plan Differentiated Tasks: Level 3 Students will generate graphs using manipulatives and analyze different characteristics about what has been graphed. Level 2 Students will arrange the manipulatives on the bar graph template and complete a bar graph. Level 1 Students will participate in making bar graphs by exploring manipulatives and experiencing making graphs. Materials/Resources: Object Manipulatives, premade bag of Skittles, graph template, graphing trays for each student, PowerPoint on graphs, and word cards. Assessment Strategies: This section needs to be completed based on the strategies appropriate for the students in your class. IEP Connections: This section needs to be completed based on the IEPs documented in the students’ ARDs in your class. Lower level ideas for stations: North East Independent School District TEKS Based Lesson Plan North East Independent School District
