Paleotemperatures from fluid inclusion liquid-vapor
advertisement

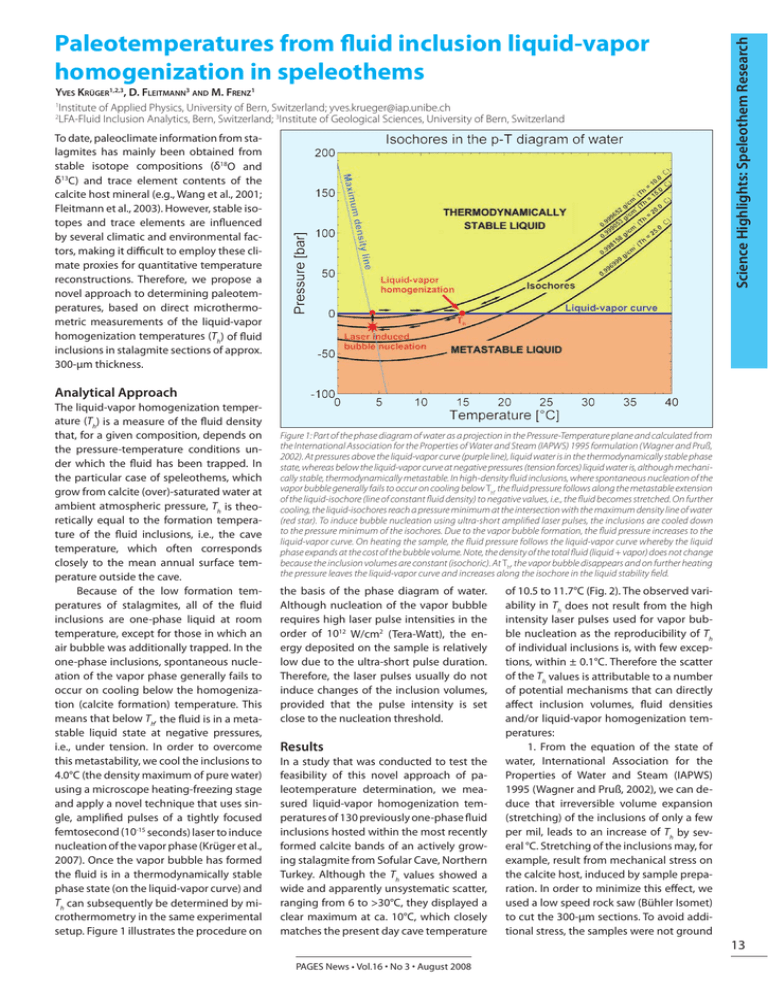
Yves Krüger1,2,3, D. Fleitmann3 and M. Frenz1 1 Institute of Applied Physics, University of Bern, Switzerland; yves.krueger@iap.unibe.ch 2 LFA-Fluid Inclusion Analytics, Bern, Switzerland; 3Institute of Geological Sciences, University of Bern, Switzerland To date, paleoclimate information from stalagmites has mainly been obtained from stable isotope compositions (δ18O and δ13C) and trace element contents of the calcite host mineral (e.g., Wang et al., 2001; Fleitmann et al., 2003). However, stable isotopes and trace elements are influenced by several climatic and environmental factors, making it difficult to employ these climate proxies for quantitative temperature reconstructions. Therefore, we propose a novel approach to determining paleotemperatures, based on direct microthermometric measurements of the liquid-vapor homogenization temperatures (Th) of fluid inclusions in stalagmite sections of approx. 300-µm thickness. Science Highlights: Speleothem Research Paleotemperatures from fluid inclusion liquid-vapor homogenization in speleothems Analytical Approach The liquid-vapor homogenization temperature (Th) is a measure of the fluid density that, for a given composition, depends on the pressure-temperature conditions under which the fluid has been trapped. In the particular case of speleothems, which grow from calcite (over)-saturated water at ambient atmospheric pressure, Th is theoretically equal to the formation temperature of the fluid inclusions, i.e., the cave temperature, which often corresponds closely to the mean annual surface temperature outside the cave. Because of the low formation temperatures of stalagmites, all of the fluid inclusions are one-phase liquid at room temperature, except for those in which an air bubble was additionally trapped. In the one-phase inclusions, spontaneous nucleation of the vapor phase generally fails to occur on cooling below the homogenization (calcite formation) temperature. This means that below Th, the fluid is in a metastable liquid state at negative pressures, i.e., under tension. In order to overcome this metastability, we cool the inclusions to 4.0°C (the density maximum of pure water) using a microscope heating-freezing stage and apply a novel technique that uses single, amplified pulses of a tightly focused femtosecond (10-15 seconds) laser to induce nucleation of the vapor phase (Krüger et al., 2007). Once the vapor bubble has formed the fluid is in a thermodynamically stable phase state (on the liquid-vapor curve) and Th can subsequently be determined by microthermometry in the same experimental setup. Figure 1 illustrates the procedure on Figure 1: Part of the phase diagram of water as a projection in the Pressure-Temperature plane and calculated from the International Association for the Properties of Water and Steam (IAPWS) 1995 formulation (Wagner and Pruß, 2002). At pressures above the liquid-vapor curve (purple line), liquid water is in the thermodynamically stable phase state, whereas below the liquid-vapor curve at negative pressures (tension forces) liquid water is, although mechanically stable, thermodynamically metastable. In high-density fluid inclusions, where spontaneous nucleation of the vapor bubble generally fails to occur on cooling below Th, the fluid pressure follows along the metastable extension of the liquid-isochore (line of constant fluid density) to negative values, i.e., the fluid becomes stretched. On further cooling, the liquid-isochores reach a pressure minimum at the intersection with the maximum density line of water (red star). To induce bubble nucleation using ultra-short amplified laser pulses, the inclusions are cooled down to the pressure minimum of the isochores. Due to the vapor bubble formation, the fluid pressure increases to the liquid-vapor curve. On heating the sample, the fluid pressure follows the liquid-vapor curve whereby the liquid phase expands at the cost of the bubble volume. Note, the density of the total fluid (liquid + vapor) does not change because the inclusion volumes are constant (isochoric). At Th, the vapor bubble disappears and on further heating the pressure leaves the liquid-vapor curve and increases along the isochore in the liquid stability field. the basis of the phase diagram of water. Although nucleation of the vapor bubble requires high laser pulse intensities in the order of 1012 W/cm2 (Tera-Watt), the energy deposited on the sample is relatively low due to the ultra-short pulse duration. Therefore, the laser pulses usually do not induce changes of the inclusion volumes, provided that the pulse intensity is set close to the nucleation threshold. Results In a study that was conducted to test the feasibility of this novel approach of paleotemperature determination, we measured liquid-vapor homogenization temperatures of 130 previously one-phase fluid inclusions hosted within the most recently formed calcite bands of an actively growing stalagmite from Sofular Cave, Northern Turkey. Although the Th values showed a wide and apparently unsystematic scatter, ranging from 6 to >30°C, they displayed a clear maximum at ca. 10°C, which closely matches the present day cave temperature PAGES News • Vol.16 • No 3 • August 2008 of 10.5 to 11.7°C (Fig. 2). The observed variability in Th does not result from the high intensity laser pulses used for vapor bubble nucleation as the reproducibility of Th of individual inclusions is, with few exceptions, within ± 0.1°C. Therefore the scatter of the Th values is attributable to a number of potential mechanisms that can directly affect inclusion volumes, fluid densities and/or liquid-vapor homogenization temperatures: 1. From the equation of the state of water, International Association for the Properties of Water and Steam (IAPWS) 1995 (Wagner and Pruß, 2002), we can deduce that irreversible volume expansion (stretching) of the inclusions of only a few per mil, leads to an increase of Th by several °C. Stretching of the inclusions may, for example, result from mechanical stress on the calcite host, induced by sample preparation. In order to minimize this effect, we used a low speed rock saw (Bühler Isomet) to cut the 300-µm sections. To avoid additional stress, the samples were not ground 13 Science Highlights: Speleothem Research 3. As the vapor bubble cannot become infinitely small upon heating, Th can be regarded as the temperature of bubble collapse i.e., the temperature where the bubble is no longer mechanically stable. We therefore assume that Th does not solely depend on the fluid density but also on the factors that control surface-tensionmediated bubble collapse. Thus collapse of the vapor bubble provides a potential explanation for Th values that are too low but presumably also for values that are too high, due to mechanisms that can stabilize the vapor bubble. A better understanding of the fundamental physical parameters that control bubble collapse in the fluid inclusion micro-systems could potentially help us to apply a correction to the measured Th values. Conclusions and outlook Figure 2: The distribution of 111 (of a total 130) fluid inclusion liquid-vapor homogenization temperatures (Th) obtained from an actively growing stalagmite from Sofular Cave, Northern Turkey (sample So-2). The inclusions are located within the most recent calcite layers and were formed during the last ~20–50 years. Color scale indicates the relative ages of the inclusions. Temperatures derived from the inclusions can be directly compared to the actual cave temperature. Although Th values scatter widely, from 6 to >30°C (Th values ≥30°C are not shown), they display a clear maximum at ca. 10°C, which is close to the present day cave temperature (measured in 2007). Note, there is no correlation between Th and the age of the inclusions. and polished, but were instead made transparent using immersion oil. Besides sample preparation, stretching may also result from high internal fluid pressures, which occur when the inclusions are exposed to temperatures above Th during transport and storage of the stalagmite samples or in the laboratory. From the phase diagram of water (Fig. 1), it can be seen that fluid inclusions that formed, for example, at 10°C, reach internal pressures of approx. 60 bar at 25°C. To avoid such large internal fluid pressures in future studies, the stalagmite samples have to be kept at a constant temperature (i.e., the cave temperature) during the transport from the cave to the laboratory and during sample preparation. 14 2. Some of the inclusions have strongly elongated shapes orientated parallel to the growth direction of the stalagmites, as shown in Figure 3. We propose that capillary forces could lead to stretching of the fluid during formation of the inclusions. Thus, the original density of the trapped fluid is too low and does not correspond to the actual formation temperature, and consequently the resulting Th values are too high. Since this is a primary effect, it cannot be avoided or minimized. It is not yet known to what extent capillary forces affect the fluid density but it is likely that their influence would be larger during dry periods, when the evaporation rate at the surface of the stalagmites increases. The results of this study confirm that liquid-vapor homogenization temperatures of fluid inclusions can be used to determine stalagmite formation temperatures and thus represent a promising analytical approach to reconstructing paleotemperature variations. However, considerable effort is still necessary to develop a reliable methodology that provides a reduced scatter of the Th values and useful criteria for acquisition, processing and refinement of the data. The goal is to achieve an accuracy in temperature determination within ± 1.0°C or better, at a high temporal resolution. In our study, we measured Th values from fluid inclusions that are hosted within several growth bands that cover approx. the last 20-50 years. Future work will focus on inclusions that formed during distinct climatic events (e.g., the Younger Dryas) to reconstruct paleotemperature evolution. These studies may also provide an insight into potential re-equilibration of the volume properties of the inclusions under changed temperature conditions and recrystallization of the calcite host. References Figure 3: Fluid inclusions with strongly elongated shapes containing liquid water (L) and a tiny bubble of water vapor (V) that has previously been induced by single ultra-short laser pulses. Maximum volume of these vapor bubbles only accounts for ~0.04% of total inclusion volume (at 4.0°C). Therefore, the vapor bubble can only be optically resolved in relatively large inclusions (typically >20 – 30 µm in length). The visibility of the vapor phase is additionally hindered by the fact that the vapor bubble generally sticks to the inclusion walls and does not move around within the inclusion. PAGES News • Vol.16 • No 3 • August 2008 Fleitmann, D., Burns, S.J, Mudelsee, M., Neff, U., Kramers, J., Mangini, A. and Matter, A., 2003: Holocene forcing of the Indian monsoon recorded in a stalagmite from Southern Oman, Science, 300: 1737-1739. Krüger, Y., Stoller, P., Rička, J. and Frenz, M., 2007: Femtosecond lasers in fluid inclusion analysis: Overcoming metastable phase states, European Journal of Mineralogy, 19: 693-706. Wagner, W. and Pruß, A., 2002: The IAPWS formulation 1995 for the thermodynamic properties of ordinary water substance for general and scientific use, Journal of Physical and Chemical Reference Data, 31: 387-535 Wang, Y.J., Cheng, H., Edwards, R.L., An, Z.S., Wu, J.Y., Shen, C.C. and Dorale, J.A. 2001: A high-resolution absolute-dated Late Pleistocene monsoon record from Hulu Cave, China, Science, 294: 2345-2348.


