Two-dimensional temporal modes in nonparallel flows
advertisement
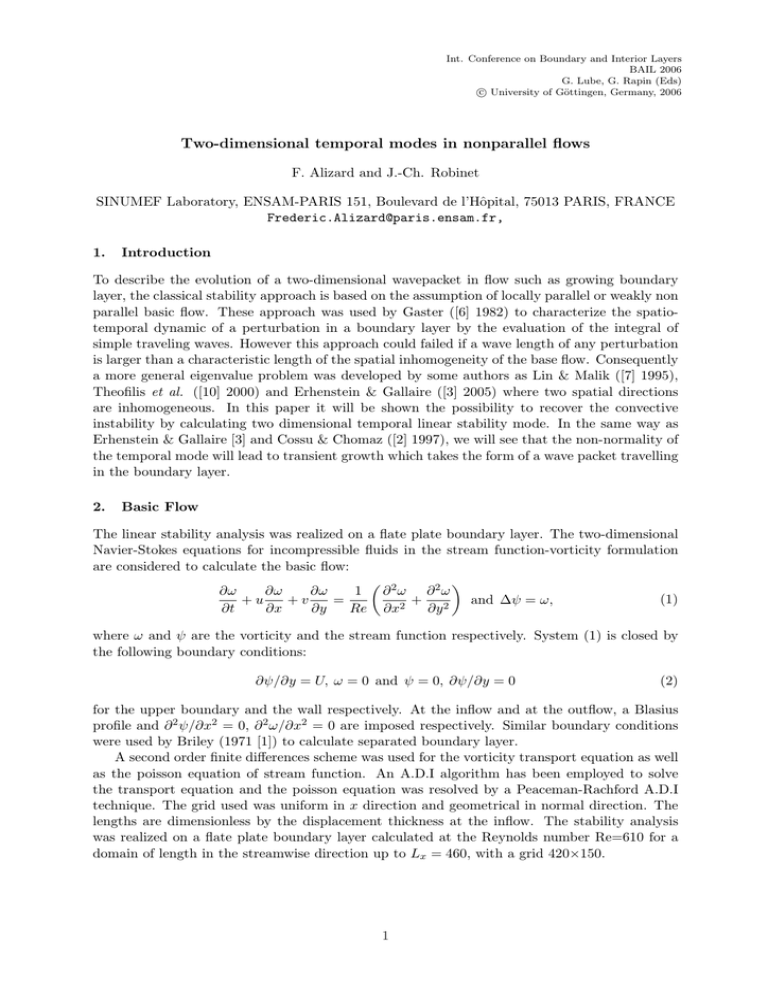
Int. Conference on Boundary and Interior Layers BAIL 2006 G. Lube, G. Rapin (Eds) c University of Göttingen, Germany, 2006 ° Two-dimensional temporal modes in nonparallel flows F. Alizard and J.-Ch. Robinet SINUMEF Laboratory, ENSAM-PARIS 151, Boulevard de l’Hôpital, 75013 PARIS, FRANCE Frederic.Alizard@paris.ensam.fr, 1. Introduction To describe the evolution of a two-dimensional wavepacket in flow such as growing boundary layer, the classical stability approach is based on the assumption of locally parallel or weakly non parallel basic flow. These approach was used by Gaster ([6] 1982) to characterize the spatiotemporal dynamic of a perturbation in a boundary layer by the evaluation of the integral of simple traveling waves. However this approach could failed if a wave length of any perturbation is larger than a characteristic length of the spatial inhomogeneity of the base flow. Consequently a more general eigenvalue problem was developed by some authors as Lin & Malik ([7] 1995), Theofilis et al. ([10] 2000) and Erhenstein & Gallaire ([3] 2005) where two spatial directions are inhomogeneous. In this paper it will be shown the possibility to recover the convective instability by calculating two dimensional temporal linear stability mode. In the same way as Erhenstein & Gallaire [3] and Cossu & Chomaz ([2] 1997), we will see that the non-normality of the temporal mode will lead to transient growth which takes the form of a wave packet travelling in the boundary layer. 2. Basic Flow The linear stability analysis was realized on a flate plate boundary layer. The two-dimensional Navier-Stokes equations for incompressible fluids in the stream function-vorticity formulation are considered to calculate the basic flow: µ ¶ ∂ω ∂ω 1 ∂2ω ∂2ω ∂ω (1) +u +v = + and ∆ψ = ω, ∂t ∂x ∂y Re ∂x2 ∂y 2 where ω and ψ are the vorticity and the stream function respectively. System (1) is closed by the following boundary conditions: ∂ψ/∂y = U, ω = 0 and ψ = 0, ∂ψ/∂y = 0 (2) for the upper boundary and the wall respectively. At the inflow and at the outflow, a Blasius profile and ∂ 2 ψ/∂x2 = 0, ∂ 2 ω/∂x2 = 0 are imposed respectively. Similar boundary conditions were used by Briley (1971 [1]) to calculate separated boundary layer. A second order finite differences scheme was used for the vorticity transport equation as well as the poisson equation of stream function. An A.D.I algorithm has been employed to solve the transport equation and the poisson equation was resolved by a Peaceman-Rachford A.D.I technique. The grid used was uniform in x direction and geometrical in normal direction. The lengths are dimensionless by the displacement thickness at the inflow. The stability analysis was realized on a flate plate boundary layer calculated at the Reynolds number Re=610 for a domain of length in the streamwise direction up to Lx = 460, with a grid 420×150. 1 3. Two dimensional linear stability analysis 3..1. Generalities The proposed linear stability analysis is based on the classical perturbations technique where the instantaneous flow (q) is the superposition of the basic flow (Q), data of this problem, and unknown perturbation (q̃): q(x, y, t) = Q(x, y) + εq̃(x, y, t) + cc, ε ¿ 1 . A wave form have been taken for the perturbation : q̃(x, y, t) = q̂(x, y) exp(−iΩt) where Ω is the circular global frequency of the fluctuation and q̂ = (û, v̂, p̂)T the two-dimensional amplitude function of the perturbation. Then the two-dimensional generalized eigenvalue problem obtained by the linearized incompressible Navier Stokes equations was defined by: ∂ û ∂v̂ + = 0, ∂x ∂y ¸ · ∂U ∂U ∂ p̂ L+ û + v̂ + − iΩû = 0, (3) ∂x ∂y ∂x · ¸ ∂V ∂V ∂ p̂ v̂ + û + − iΩv̂ = 0, L+ ∂y ∂x ∂y µ 2 ¶ ∂ ∂ 1 ∂2 ∂ +V . A Chebyshev/ Chebyshev collocation spectral where L = − + +U Re ∂x2 ∂y 2 ∂x ∂y method was used to discretize the problem. 3..2. Boundary conditions The boundary conditions u = 0, v = 0, are imposed on the perturbation velocity components at the wall and the upper boundary. In following the article of Erhenstein & Gallaire [3], compatibility boundary conditions with convective instability are imposed at inflow and outflow of the domain. The main idea was to use a Gaster type relation (1962 [5]) that links the spatial growth to the temporal growth. Consequently the relation (4) are applied on the velocity perturbations at inflow and outflow of the domain. Under the assumption of a locally parallel flow the expansion (4) was realized by solving Orr-Sommerfeld on the same basic flow at inflow and outflow. Ω0 was chosen near the neutral curve so that the relation (4) was justified. ∂αr ∂u = iαu with α ≈ α0,r + (Ω0 )(Ω − Ω0 ) (4) ∂x ∂Ω Finally no boundary conditions are applied on the pressure perturbation but only constraints. As it is referred in the article of Phillips & Roberts (1993 [11]) there are 8 spurious pressure modes in incompressible flow calculation when using a Chebyshev/ Chebyshev discretization: 4 at the corners, the line, column and checkerboard modes and the constant one. Spurious pressure modes are removed by means of a singular value decomposition. Consequently the corresponding velocity perturbation field was divergence free at all the collocation points. 3..3. Numerical method The system (3) associated with the boundary conditions define the eigenvalue problem: AX = iΩX (5) where the vector X contains the velocity and pressure disturbances and iΩ is the eigenvalue. It was solved by a shift and invert Arnoldi algorithm. Then the original eigenvalues problem was convert into: ¡ ¢ 1 A − λB−1 BX = µX, µ = (6) iΩ − λ 2 0 L=230 L=340 L=400 Ωi -0.005 -0.01 -0.015 0 0.05 Ωr 0.1 0.15 Figure 1: Spectrum resulting for the bidimensional analysis for the three domain lengths considered. where λ is a shift parameter. Following Theofilis ([9] 2003) Krylov subspace iterations were provided on (6) until convergence. A Krylov subspace of dimension 250 allowed to recover a sufficient part of the spectrum considered. 4. Two dimensional temporal modes The influence of the domain at Reynolds number 610 was studied on temporal modes resulting of the stability analysis. The two dimensional stability modes was computed for three domains: 230, 340, 400 for an height of 20. Following the study of Erhenstein & Gallaire [3] we used 180 × 45 grid for calculation. The spectrum resulting are shown on figure 1. All modes have a negative imaginary part in accordance with the fact the flat plate boundary layer is convectively unstable but globally stable. The space between modes as well as the imaginary parts are dependant of the length of the domain, boundary conditions varying as well as the domain length change. Nevertheless the positionning of these discrete modes are not still understood. The real parts of eigenfunctions relatives to the streamwise velocity perturbation shown on figure 2 are particularly interesting. Indeed eigenfunctions are reminiscent to a TollmienSchlichting wave where the wave length seems to be characterized by the complex pulsation for a domain length, similar to a dispersion relation of a local analysis. Moreover the treatment of the boundary conditions for pressure gave quite good results as it can be shown on figure 2. In order to evaluate the validity of results a similar study as Fasel ([4] 1990) for a direct numerical simulation has been realized. For the longest domain, wave number, amplitude and eigenfunctions have been compared with an 1D linear stability analysis for two complex pulsations. The perturbation can be written as û = |û|exp(iΘu (x, y)) and v̂ = |v̂|exp(iΘv (x, y)) where Θu is the phase of the wave relative to the disturbance following x, and Θv the one following y. Consequently the relationships for calculating the wave number αr are : αru = αrv = ∂Θu (x, y) , ∂x ∂Θv (x, y) , ∂x (7a) (7b) Wave numbers have been evaluated for y = 4.4. Amplification curves have been realized with the energy criteria and compared to the 1D linear stability using the relationship : · Z x ¸ A = exp − αi (ξ)dξ (8) A0 x0 3 a) b) 10 10 Y 15 Y 15 5 0 200 5 250 300 X 350 0 100 400 c) 150 200 250 X 300 350 400 150 200 250 X 300 350 400 d) 10 10 Y 15 Y 15 5 0 200 5 250 300 X 350 400 0 100 Figure 2: (a), (b) real part of eigenfunctions relative to streamwise disturbances; (c), (d) real part of eigenfunctions relative to pressure disturbances, for length 400. On the left for the mode Ωr ' 0.068, on the right Ωr ' 0.098. where x0 located the begining of the flate plate. Results on two-dimensional stability analysis shown on figure 3 for the pulsation Ωr ≈ 0.068 and Ωr ≈ 0.099 seem to be in accordance with the Orr-Sommerfeld analysis for the wave number and the amplitude. However we could see that wave number is quite oscillating around the 1D stability solution, and there is a slight influence of boundary conditions at inflow and outflow that being able to be explained by the 1D stability approach to evaluate the expansion (4). Finally differences between amplitude curves could be explained by the non-parallel correction, this one predicting an higest amplitude than OrrSommerfeld analysis. Indeed similar discrepancies have been observed by Fasel [4] in comparison with Navier-Stokes calculation. Eigenfunctions plotted on figure 4 have also been compared for the pulsation Ωr ≈ 0.068 at x = 260. The similarity between two-dimensional analysis and OrrSommerfeld is really remarkable. This similarity was expected by the fact that rapid variation scale of the boundary layer stability is relative to the exponential term while the slow one is characterized by eigenfunctions. Consequently non-parallel effects influence less eigenfunctions. 5. Transient growth: wave packet dynamic In order to describe the evolution of perturbations in the transient they have been expressed in a two dimensional eigenvectors basis as follow: Q(x, y, t) = N X Kk0 exp(−iΩk t)q̂k (x, y) (9) k=1 with N the number of two dimensional modes taken into account q̂k (x, y), Ωk eigenvectors and eigenmodes respectively, Kk0 the initial energy injected along each eigenvectors. Although the evolution of each component of the basis vector decreased in time (the imaginary part of each eigenmode being negative) the non normality of the operator could create transient growth (see Schmid & Henningson [8] 2001). Then the maximum of the energy at time 4 a) b) 0.24 α 2D u α 2D v α 1D 0.3 α 2D u α 2D v α 1D 0.28 0.2 α α 0.22 0.18 0.26 0.24 0.160 50 0.220 100 150 200 250 300 350 400 x c) 50 100 150 200 x 250 300 350 400 d) 8 25 1D 2D 1D 2D 6 A/A0 A/A0 20 15 4 10 2 5 0 50 0 100 150 200 250 300 350 400 x 50 100 150 200 250 300 350 400 x Figure 3: (a), (b) wave numbers α(x) comparison for pulsations Ωr ' 0.068, Ωr ' 0.098 respectively. (c), (d) Amplitude curves AA0 (x) for the same plusations. 1 |u|, |v| 0.8 |u| 1D |u| 2D |v| 1D |v| 2D 0.6 0.4 0.2 00 5 10 y 15 20 Figure 4: Comparison of eigenfunctions form 2D and 1D stability analysis taken at x = 260. 5 5 E(t) 4 3 2 1 0 200 400 600 Times 800 Figure 5: Energy growth in red, green and blue for the domain length 230, 340, and 400 respectively. Enveloppe was in solid lines, the optimal energy growth in dashed lines. t of all possible initial condition has been studied in a orthogonal basis : G(t) = maxK 0 k E(t) = ||Fexp(tD)F−1 ||22 E(0) (10) with Dl,k = −δlk iΩk (δlk Kronecker symbol), the diagonal matrix of eigenmodes, and A = F∗ F the Cholesky decomposition of the matrix of eigenvectors scalar product A: Z HZ L û∗i ûj + v̂i∗ v̂j dx dy (11) Aij = 0 0 Consequently maximum energy amplification for time t was given by the highest singular value of the matrix Fexp(tD)F−1 . The calculation provided also the optimal disturbances in the eigenvector basis thanks to a basis change. The transient growth has been studied for three domain length 230, 340, 400. The eigenmodes taken into account are shown in the spectrum figure 1. The energy growth resulting are depicted on figure 5, in red green and blue for length 230, 340, 400 respectively, dashed lines representing the evolution of initial disturbances leading to an optimal energy growth. As it has been shown on the article of Cossu & Chomaz [2] and Erhenstein & Gallaire [3], the non normality of global eigenmodes producing large transient growth (up to ' 5.8 for the length 400) can be interpreted in terms of local convective instability. Indeed it can be seen on the figure 6 than optimal perturbation ”can be thought of as a collection of initially excited non-normal global modes whose amplitude decrease in time but whose superposition produces a wave packet initially growing in time and moving in space as the relative phases of modes vary” [2]. For the energy curves illustrated by fig.5, the wave packet grows as it is travelling in the domain and starts to decrease when it is leaving (see 5, 6). The interesting part is the domain lenght has no influence on the final resulting wave packet. As it was shown on figure 5 the growth of the optimal disturbances in time is almost the same until the wave packet left the flat plate whatever the domain lenght considered. Finally the use of optimal disturbances could be related to the wave packet analysis in the local approach by looking for waves which reinforce one another, instead of tending to cancel out by interference (Gaster [5]). 6 15 y 10 5 0 0 50 100 x 150 200 0 200 250 300 x 350 400 15 y 10 5 Figure 6: Wave packet resulting of non-normal global modes for the domain length 400, for times 0 and 600. 6. Conclusion In this paper it has been recovered that a convective stability of a flat plate boundary layer could be captured by a two-dimensional stability analysis, as it was demonstrated in the arcticle of Erhenstein & Gallaire [3]. Moreover it has been compared wave numbers, amplitude and eigenfunctions of two-dimensional modes with an 1D linear stability analysis. Results gave quite good similarities between the two approaches. However a weakly non-parallel stability analysis would be more appropriate for comparison, amplitude curves being strongly dependant of this correction (for example multiple scales or PSE). Finally the transient growth analysis allowed to recover than optimal distrubance takes the form of a wave packet which grows as it is travelling on the flate plate whose general form is independant of the calculation domain. These results were very similar to the study of Gaster [6] by a WKB analysis, then it would be interesting to compare more precisely the two wave packets. References [1] WR. Briley. A numerical study of laminar separation bubbles using the Navier-Stokes equations. J. Fluid. Mech, 47:713–736, 1971. [2] C. Cossu and Chomaz J.-M. Global measures of local convective instabilities. Phys. Rev. Lett., 78:4387–4390, 1997. [3] U. Ehrenstein and F. Gallaire. On two dimensional temporal modes in spatially evolving open flows: the flat-plate boundary layer. J. Fluid Mech., 78:4387–4390, 2005. 7 [4] H. Fasel and U. Konzelmann. Non-parallel stability of a flat-plate boundary layer using the complete navier-stokes equations. J. Fluid Mech., 221:311–347, 1990. [5] M. Gaster. A note on the relation between temporally increasing and spatially increasing disturbances in hydrodynamic stability. J. Fluid. Mech, 14:222–224, 1962. [6] M. Gaster. The development of a two-dimensional wavepacket in a growing boundary layer. Proc. R. Soc. London, 384:317–332, 1982. [7] R.S. Lin and M.R. Malik. On the stability of attachment-line boundary layers. J. Fluid Mech., 333:125–137, 1995. [8] P.J. Schmid and D.S. Henningson. Stability and transition in shear fows. Springer, 2001. [9] V. Theofilis. Advances in global linear instability of nonparallel and three-dimensional flows. Prog. in Aerospace Sciences, 39:249–315, 2003. [10] V. Theofilis, S. Hein, and U. Dallmann. On the origins of unsteadiness and three dimensionality in a laminar separation bubble. Proc. R. Soc. London., 358:3229–3246, 2000. [11] N. P. Timothy and W. R. Gareth. The treatment of spurious pressure modes in spectral incompressible flow calculations. Journal of Computational Physics, 105:150–164, 1993. 8
