LTI System Properties: Linearity, Time Invariance, Cascade Systems
advertisement

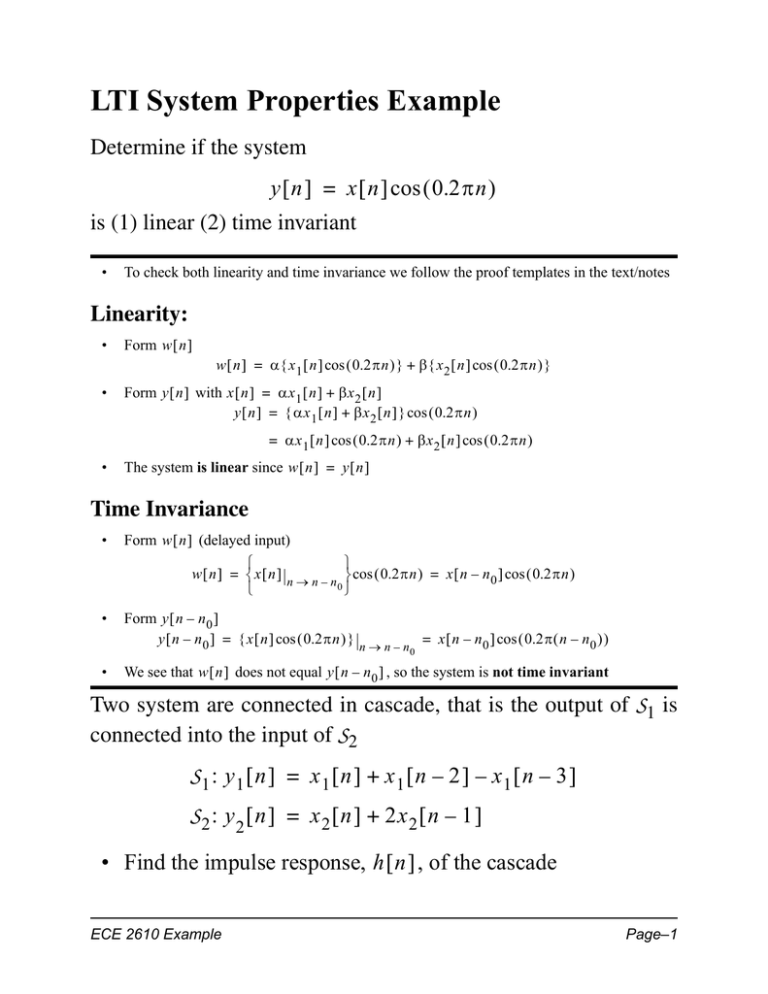
LTI System Properties Example Determine if the system y n = x n cos 0.2n is (1) linear (2) time invariant • To check both linearity and time invariance we follow the proof templates in the text/notes Linearity: • Form w n w n = x 1 n cos 0.2n + x 2 n cos 0.2n • • Form y n with x n = x 1 n + x 2 n y n = x 1 n + x 2 n cos 0.2n = x 1 n cos 0.2n + x 2 n cos 0.2n The system is linear since w n = y n Time Invariance • Form w n (delayed input) w n = x n n n – n cos 0.2n = x n – n 0 cos 0.2n 0 • Form y n – n0 y n – n 0 = x n cos 0.2n n n – n = x n – n 0 cos 0.2 n – n 0 0 • We see that w n does not equal y n – n 0 , so the system is not time invariant Two system are connected in cascade, that is the output of S1 is connected into the input of S2 S1 : y1 n = x1 n + x1 n – 2 – x1 n – 3 S 2 : y 2 n = x 2 n + 2x 2 n – 1 • Find the impulse response, h n , of the cascade ECE 2610 Example Page–1 • Draw the direct form block diagram for the first system S1 • • To find the impulse response of a two subsystem cascade, we need to convolve the individual impulse responses, i.e., form h n = h 1 n + h 2 n By inspection the impulse response of s1 is h 1 n = n + n – 2 – n – 3 = 1 0 1 – 1 n = 0 • By inspection the impulse response of s2 is h 2 n = n + 2 n – 2 = 1 2 n = 0 • We can perform the convolution using a table sum of products formed between h[k] and x[n-k] inside red box. h1[k] 0 0 0 0 0 1 0 1 -1 0 0 0 0 0 0 0 h[n] n=0 0 0 0 0 2 1 0 0 0 0 0 0 0 0 0 0 1 n=1 0 0 0 0 0 2 1 0 0 0 0 0 0 0 0 0 2 n=2 0 0 0 0 0 0 2 1 0 0 0 0 0 0 0 0 1 n=3 0 0 0 0 0 0 0 2 1 0 0 0 0 0 0 0 1 n=4 0 0 0 0 0 0 0 0 2 1 0 0 0 0 0 0 -2 n=4 0 0 0 0 0 0 0 0 0 2 1 0 0 0 0 0 0 Outputs for n < 0 and n > 4 are all 0 Flipped and shifted: h2[n-k] MATLAB Check • Expected output range [0+0, 3+1] = [0,4] >> filter([1 0 1 -1],1,[1 2 0 0 0 0]) ans = 1 2 1 1 -2 0 n=0 n=4 The direct form block diagram of s1 is follows from the text/notes 1 x[n] Unit Delay x[n - 1] Unit Delay 1 x[n - 2] Unit Delay x[n - 3] ECE 2610 Example -1 y[n] Page–2


