Qualitative graphs are graphs that are used to represent situations
advertisement

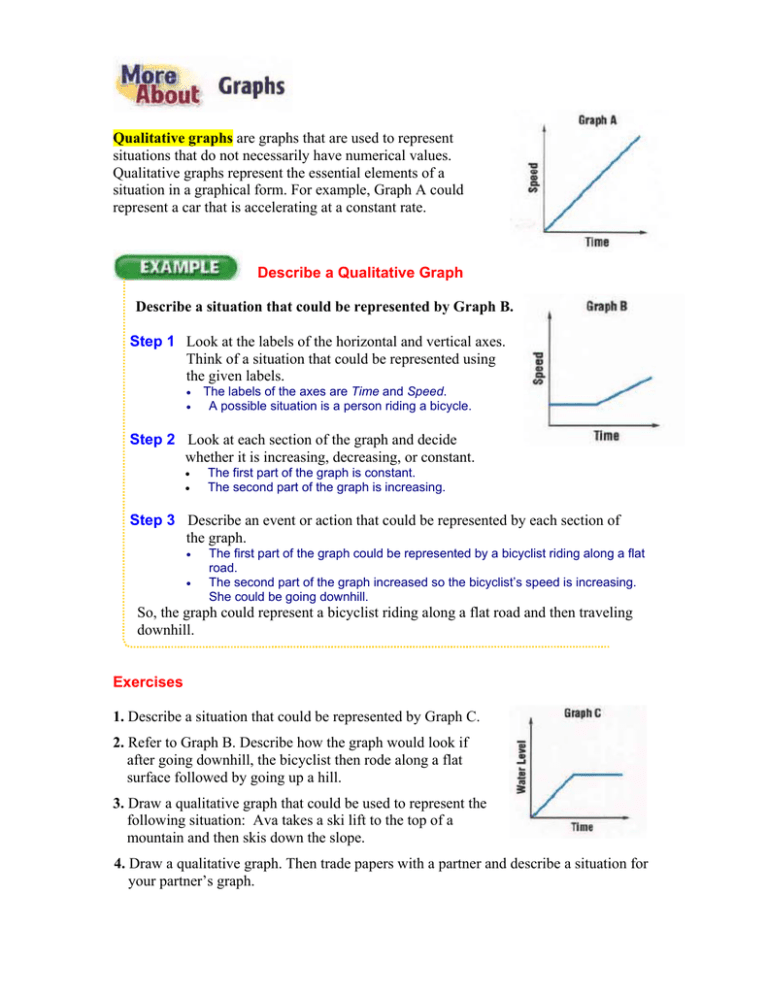
Qualitative graphs are graphs that are used to represent situations that do not necessarily have numerical values. Qualitative graphs represent the essential elements of a situation in a graphical form. For example, Graph A could represent a car that is accelerating at a constant rate. Describe a Qualitative Graph Describe a situation that could be represented by Graph B. Step 1 Look at the labels of the horizontal and vertical axes. Think of a situation that could be represented using the given labels. The labels of the axes are Time and Speed. A possible situation is a person riding a bicycle. Step 2 Look at each section of the graph and decide whether it is increasing, decreasing, or constant. The first part of the graph is constant. The second part of the graph is increasing. Step 3 Describe an event or action that could be represented by each section of the graph. The first part of the graph could be represented by a bicyclist riding along a flat road. The second part of the graph increased so the bicyclist’s speed is increasing. She could be going downhill. So, the graph could represent a bicyclist riding along a flat road and then traveling downhill. Exercises 1. Describe a situation that could be represented by Graph C. 2. Refer to Graph B. Describe how the graph would look if after going downhill, the bicyclist then rode along a flat surface followed by going up a hill. 3. Draw a qualitative graph that could be used to represent the following situation: Ava takes a ski lift to the top of a mountain and then skis down the slope. 4. Draw a qualitative graph. Then trade papers with a partner and describe a situation for your partner’s graph.


