Power Quality (PQ)
advertisement

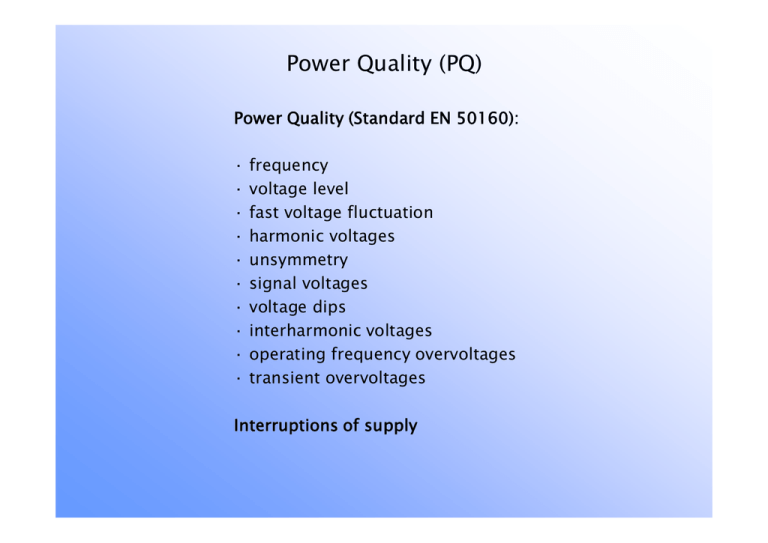
Power Quality (PQ) Power Quality (Standard EN 50160): · · · · · · · · · · frequency voltage level fast voltage fluctuation harmonic voltages unsymmetry signal voltages voltage dips interharmonic voltages operating frequency overvoltages transient overvoltages Interruptions of supply Frequency Std 50160: limits for 10 second values: · 95% in the band 50 Hz +/- 1% (49.5 … 50.5 Hz) · all in the band 50 Hz +4/-6% (47 … 52 Hz) In Nordic system usually between +/- 0.1 Hz Voltage level Std 50160: limits for 10 minute values · 95% must be in the band Un +/- 10% Measurement for one complete week In addition, all the 10 min values must be between -15 .. +10 % In LV-system, according to association of utilities (sener): · good quality: 10 min values between 220…240 V · normal quality: 10 min values between 207…244 V · standard quality: 10 min values between 207…253 V In MV-system, according to association of utilities (sener): · good quality: 10 min values between Un +/- 4% · normal quality: 10 min values between Un +/- 10% · standard quality: 10 min values between Un +/- 10% Voltage level is determined by voltage drop due to load current, on-load tap-changer, off-load tap-changer and compensation. Fast voltage fluctuation (flicker) Affects especially lighting and hence vision. Also electronic equipment may be disturbed. Fast voltage fluctuation is caused by, · control of on-load tap-changer · motor starting · welding equipment Limits according to CENELEC: Voltage %-change / Changes per minute Voltage unsymmetry Std 50160: limits for 10 minute values: 95% of the time the negative sequence component must be less than 2% of the positive sequence component. Unsymmetry is caused by: · uneven load between the three phases · one-phase LV-faults (blown fuse) Signal voltages Std: Defined as 3 s values, measured in LV-connection point; 99% of the time the values must be equal or less than: Signal voltages as % of nominal / Frequency kHz Frequencies 95 kHz … 148.5 kHz may be used in customer installations Voltage dips (dU > 10%) Mostly caused by faults. No limits given by standards. Interharmonic voltages Levels are increasing due to semiconductor technology development. No limits given by standards. Operating frequency overvoltages Caused mostly by faults. General limits for voltage levels used. Transient overvoltages Caused by faults and switching actions. Harmonic voltages Std 50160: limits for 10 minute mean values. total harmonic distortion THD 8% at maximum THD = 40 å (U h =2 h )2 Other harmonics: Maximum allowed harmonics as % of the nominal voltage in LV-connection point. Limits given up to the order 25. odd harmonics not multiple of 3 even harmonics multiple of 3 order voltage order voltage order voltage n %/Un n %/Un n %/UN 5 6% 3 5% 2 2% 7 5% 9 1,5 % 4 1% 11 3,5 % 15 0,5 % 6…24 0,5 % 13 3% 21 0,5 % 17 2% 19 1,5 % 23 1,5 % 25 1,5 % Harmonic currents by diode rectifiers In an ideal case (a) the harmonics of the current are: In = I1 / n n is the harmonic number n = kp +/- 1 (k = 1,2,3,…), p is the pulse number commutation (b) and ripple in DC-current (c) smooth the pulse edges, which makes the lower frequencies to increase and higher to decrease. + R S T - a) b) c) Maximum values for PWM-drives Harmonic order 5. 7. 11. 13. In/I1 30% 12% 6% 5% Other sources of harmonics: · discharge lamps · power units of electronics Harmonic series resonance · Power system as a voltage source · Transformer inductance and capacitor in series · Low voltage distortion strongly amplified Condition : 2pf = 1 LC T Z E C L C Harmonic parallel resonance · · · · · More dangerous than series resonance Transformer load as harmonic current source Transformer inductance and capacitor in parallel Resistive load causes attenuation High risk of damage to the capacitor 1 LC 2pf = Condition : S C T Y L C Y J An example case: 0,4 kV Motor control centre 2 MVA 10/0,4 kV 6% M84 M 3~ 100-600 kVAr 300-500 kW 0,85 ind 1,8 MW 0,9 ind Un / % The effect of induction machine load to the 11. And 13. harmonic voltage. Voltages % of the rated voltage. i) machine load 500 kW ii) machine load 300 kW (broken line) n=11 20 n=13 15 10 5 0 0 100 200 300 400 500 600 QC / kvar Example: Parallel harmonic resonance and the dangerous ratings of a compensation capacitor in a secondary substation: Harmonic currents In n = 5,7,11,13 20/0.4 kV Sk = 150 MVA 800 kVA 6% Qc = ? (resonance) 0,4 kV QC One-line diagram : LT Jn U2 w LV = Sk LV L C In wr = 1 LC U2 202 Þ LV = = H = 8,5 mH S kw1 150 × 2p × 50 U2 w1LT = u x SN u xU 2 0,06 × 202 Þ LT = = H = 95,5 mH S N w1 0,8 × 2p × 50 Þ L = L V + L T = 104 mH (0.4/20) 2 = 41,6mH Resonance condition : wr = 1 LC Þ C = 1 wr L 2 5. harmonic : w r = 5 × 2p × 50 rad/s = 1571 rad/s 1 Þ C = F » 9,74 mF 15712 × 0,0000416 And the compensation rating QC : ì QC = 3 U V IC í î IC = U V YC Þ QC = 3 U V 2 YC = U p 2 YC = U p 2w1C = 4002 × 2p × 50 × 9,74 10-3 VAr = 489 kVAr Resonance point at different orders : 5. C = 9,74 mF Q C = 489 kVAr Other frequencies: 7. C = 1 = 4,96 mF w7 L 1 = 2,01 mF 11. C = 2 w11 L 1 = 1,44 mF 13. C = 2 w13 L 2 Q C = 250 kVAr Q C = 101 kVAr Q C = 72 kVAr Different types of passive harmonic filters C C1 L L1 L 2. Order broad band 2.order |z| L R 3. Order broad band |z| |z| f/Hz R C2 C2 L2 1. order C1 C f/Hz |z| f/Hz f/Hz Interruptions · Planned interruptions vs. interruptions by faults · Unexpected interruptions mostly by faults in MV-network · In transmission, single fault causes no outage (n-1 criteria) · Customers outage costs are a substantial factor Typical Fault frequencies in Finnish transmission system Amount of Faults divided by cause (%) faults Other External Operation & Technical Other Unknown 1-phase Permanent faults faults (pcs / 100km,a) Lightning natural influence maintenance equipment 400 kV lines 0.11 77.5 7.8 0.9 2.9 1.0 3.9 5.8 54.0 4.0 220 kV " 0.71 46.4 3.3 3.3 0.5 0.6 1.1 44.8 67.0 3.0 110 kV " 1.29 44.2 3.9 2.1 1.3 0.5 0.9 47.1 75.0 2.0 Reclosings Fast reclosing Succesful Succesful in one end only Failed due to a permanent fault Failed due other reasons Sum 400 kV pcs % 13 87 220 kV pcs % 5 83 110 kV pcs % 177 82 sum pcs % 195 81 0 0 0 0 5 2 5 2 0 2 15 0 13 100 0 1 6 0 17 100 9 27 218 4 12 100 9 30 239 4 13 100 Annual average outages if MV-distribution networks classified by fault reasons. Faults / 100 km of line FAULT CAUSE NATURE - Wind and storm - Snow and ice - Lightnings - Other weather - animals Technical cause - Mechanical cause - misoperation others - Public misbehavior - unknown SUM BARE CONDUCTOR OVERHEAD LINES 3,39 2,38 0,53 0,29 0,20 0,18 0,54 0,39 0,19 0,84 0,30 0,51 4,71 COVERED CONDUCTOR OVERHEAD LINES 0,24 0,19 0,05 0,03 0,01 0,07 0,04 0,03 0,03 0,04 0,02 0,02 0,29 AERIAL CABLES GROUND CABLES 0,07 0,07 0,05 0,08 0,01 0,00 0,11 0,12 0,02 0,02 0,01 0,04 0,12 0,10 0,01 0,00 0,05 0,20 0,03 0,33 0,24 0,15 0,38 0,29 0,13 0,70 1973 1974 1975 1976 1977 1978 1979 1980 1981 1982 1983 1984 1985 1986 1987 1988 1989 1990 1991 1992 1993 1994 1995 1996 1997 1998 1999 2000 2001 2002 2003 Outage times in urban & rural network hrs/a in years1973…2003 10 9 8 7 6 5 4 rural 3 2 1 urban 0 Energiateollisuus 2015 Outage times in urban & rural network hrs/a in years1973…2003 2005…2014 25 20 15 rural 10 5 urban 0 2005 2006 2007 2008 2009 2010 2011 2012 2013 2014 Energiateollisuus 2015 Example: voltage dip 3-phase short circuit at a MV-line 10 km from substation Sk=1000 MVA 16 MVA Ux=10 % Ur=1 % 10 km r + jwl = 0,3 + j0,3 W/km Ik DU in 20 kV busbar ? XV XT RT Xi Ri U=? E R j + jX j U2 XV = = 0,4 W Sk U = U2 U2 XT = u x = 2,5 W ; R T = u r = 0,25 W SN SN Þ U = 0,63 E DU = 37 % X j = 10 km × 0,3 W/km = 3 W ; R j = 3 W (R T + R j ) + j(X V + X T + X j ) E = 3+ j3 E 3,25 + j 5,9 CUSTOMERS OUTAGE COSTS IN DISTRIBUTION SYSTEMS INQUIRY FORMS • Four pages: Folded A3, with four A4 pages – page 1: Letter signed by the power company – page 2-4: questions to the customers • • • Residential customers, Summer houses, Agriculture, Service sector, Public sector, Industry Network companies selected the customers included The forms were sent by mail: responses either by mail or Internet. Big customers (Service, Public, Industry) also by telephone interview Inquiry Forms • Background questions – For example: type of space heating, sector of business etc. • Outage cost assessment – All customer categories: direct costing questions • Example: costs of an unexpected 1 hour outage, in winter time, ordinary week day, morning between 5 and 10 hrs ?. • Expected / unexpected outages • Outages in different times and seasons • Outages during / ouside working hours – For residential, summer house and agriculture, also WTA and WTP methods were user (willingness to accept / pay), for households also price-elasticity method • Free comments Results: Households €/kW Outage length: Direct costing: With electric heat No electric heating Average 2min 1 hr 12hrs 36hrs 0.5 1.0 0.7 WTA/1 hr: 10.1 €/kW WTP/1hr: 1.0 €/kW Price elasticity/1 hr: 2.1 €/kW 3.2 23.9 74.0 10.3 98.4 299.0 6.5 54.9 163.7 Results: Summer houses €/kW Outage length: 2min 1 hr 12hrs 36hrs Direct costing: With electric heat No electric heating Average 0.3 8.6 4.7 33.9 91.5 297.1 25.3 49.4 74.6 24.3 75.3 172.3 Agriculture €/kW Outage length 2min 1hr 4hrs 12hrs 36hrs Cornfields Green houses Milk production Beef production Pig houses 1.0 0.1 3.0 0.0 33.5 140 11.5 143 130 14.0 140 2.1 154 135 121 45.2 182 301 299 7384 182 131 2570 PUBLIC SECTOR: Annual energies of the customers responded Horizontal axis: Annual energies - Vertical axis: number of customers PUBLIC SECTOR Direct costing results €/kW Outage length 2min 1hr 4hrs 12hrs 24hrs Winter-mean Winter-median 3.1 0.0 34.3 124 450 1050 5.5 21.9 72.3 150.6 Summer-mean Summer-median 4.5 0.0 25.2 77.1 482 685 4.9 16.7 68.8 88.0 Public sector: direct costing results 1s 1h 12 h X-axis: cost estimate €/kW, y-axis number of cases, unexpexted outage in winter day SERVICE SECTOR: Annual energies of the customers responded Horizontal axis: Annual energies - Vertical axis: number of customers Service sector: Broken equipment due to short interruptions • Number of equipment breaks 50 (20%) • Average costs per failure 1105 € • Maximum cost per failure 10000€ Service sector Direct costs €/kW Outage length 2min 1hr 4hrs 12hrs 24hrs Winter-mean Winter-median 0.9 0.0 5.3 0.2 14.8 49.1 102 2.9 27.7 67.8 Summer-mean Summer-median 6.0 0.0 42.7 130 267 18.8 67.4 143 358 197 Service sector: Direct costs €/kW 1s 1h 12 h X-axis: cost estimate €/kW, y-axis number of cases, unexpexted outage in winter day INDUSTRIAL SECTOR: Responses & annual energies Horizontal axis: Annual energies - Vertical axis: number of customers INDUSTRIAL SECTOR: Direct costs €/kW 1s 1h 12 h X-axis: cost estimate €/kW, y-axis number of cases, unexpexted outage in winter day Industrial sector: Direct costs €/kW Outage length 2min 1hr 4hrs 8hrs 24hrs Unexpexted in working hrs 2.4 21.6 76.2 141 190 Planned in working hrs 0.3 10.3 36.4 90.0 121 - 2.4 - 33.3 - Unexpected outside work hrs INDUSTRIAL CUSTOMERS: planned / unexpected outages X-axis: outage duration - Y-axis: cost of planned outage / cost of unexpected outage CONCLUSIONS • Outage costs vary largely depending on – time of outage – length of outage – customer class and subclass – between different customers in same category • The distribution of outage costs is skew – the difference between mean and median values is big CONCLUSIONS Typical total outage costs €/kW and marginal costs €/kWh Customer group Total cost 1hr 12hrs Marginal costs 1 hr 12hrs Households Summer houses Argiculture 3-10 2-20 3-16 25-60 48-81 50-120 3-7 2-17 3-13 2-5 4-7 5-11 Service Public Industry 4-60 5-35 7-22 25-270 60-450 50-190 4-47 5-30 7-20 2-25 5-41 4-15 STANDARD COMPENSATION For longer outages, DSO has to compensate to the customers as follows: – 12-24 h ó 10% of annual transmission fee – 24-72 h ó 25% of annual transmission fee – 72-120 h ó 50% of annual transmission fee – 120-192 h ó 100% of annual transmission fee – 192-288 h ó 150% of annual transmission fee – Yli 288 h ó 200% of annual transmission fee Max payment is 2000 EUR

