TE C HN I C AL RE P O RT
Headroom Predictions Using B-Noise in MAPP XT
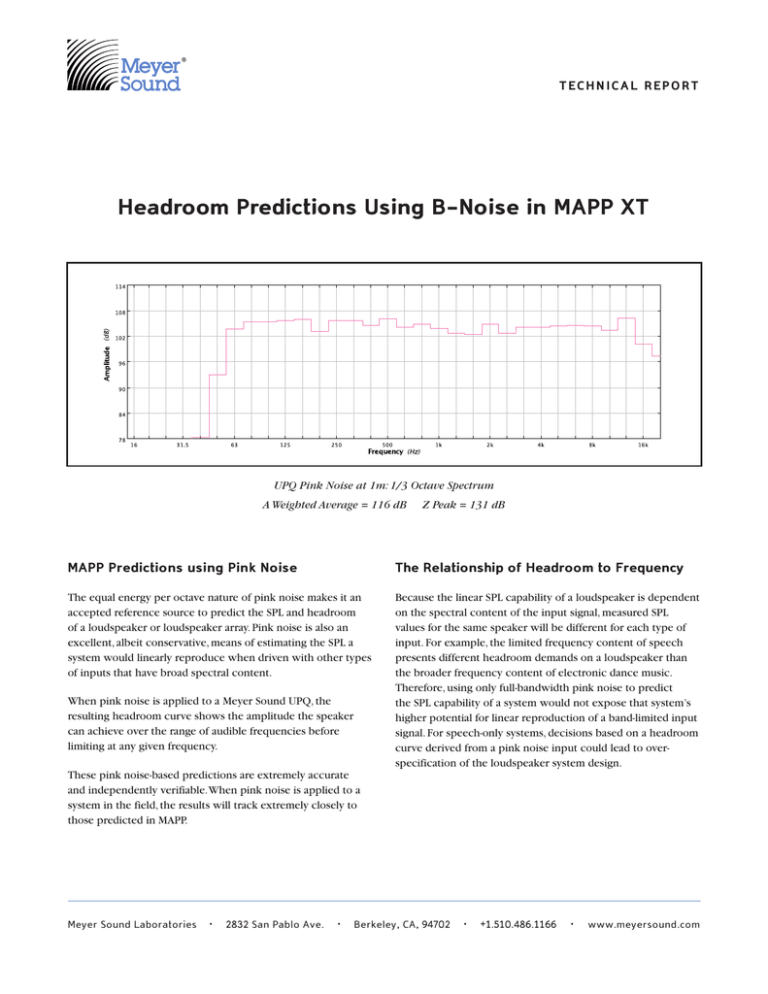
UPQ Pink Noise at 1m: 1/3 Octave Spectrum
A Weighted Average = 116 dB
Z Peak = 131 dB
MAPP Predictions using Pink Noise
The Relationship of Headroom to Frequency
The equal energy per octave nature of pink noise makes it an
accepted reference source to predict the SPL and headroom
of a loudspeaker or loudspeaker array. Pink noise is also an
excellent, albeit conservative, means of estimating the SPL a
system would linearly reproduce when driven with other types
of inputs that have broad spectral content.
Because the linear SPL capability of a loudspeaker is dependent
on the spectral content of the input signal, measured SPL
values for the same speaker will be different for each type of
input. For example, the limited frequency content of speech
presents different headroom demands on a loudspeaker than
the broader frequency content of electronic dance music.
Therefore, using only full-bandwidth pink noise to predict
the SPL capability of a system would not expose that system’s
higher potential for linear reproduction of a band-limited input
signal. For speech-only systems, decisions based on a headroom
curve derived from a pink noise input could lead to overspecification of the loudspeaker system design.
When pink noise is applied to a Meyer Sound UPQ, the
resulting headroom curve shows the amplitude the speaker
can achieve over the range of audible frequencies before
limiting at any given frequency.
These pink noise-based predictions are extremely accurate
and independently verifiable. When pink noise is applied to a
system in the field, the results will track extremely closely to
those predicted in MAPP.
Meyer Sound Laboratories
•
2832 San Pablo Ave.
•
Berkeley, CA, 94702
•
+1.510.486.1166
•
www.meyersound.com
Introducing B-Noise
To help our users understand how loudspeakers react to different input signals,
users
Headroom Predictions Using B-­‐Noise in MAPP XT react to different input signals,
helpTITLE: our developed
understand
how
loudspeakers
Meyer To
Sound
has
an additional
input source for MAPP called B-Noise.
Part Number: 01.083.008.01 Meyer Sound has developed an additional input source for MAPP called B-Noise.
Headroom Predictions Using B-Noise in MAPP XT
Introducing B-Noise
MEYER SOUND
“Band-Limited
Pink Noise”
is pink noise that has been filtered using the
“Band-Limited
Pink
Noise” is pink noise that has been filtered using the
To help our formula:
users understand how loudspeakers react to different input signals,
following
B-Contour
following
B-Contour
formula:
Introducing
B-Noise
Meyer
Sound has developed
an additional input source for MAPP called B-Noise.
“Band-Limited Pink Noise” is pink noise that has been filtered
To help our users understand
how loudspeakers
“Band-Limited
Pink Noise” isreact
pink noise that has been filtered using the
using the following B-Contour formula:
following
to different input signals,
MeyerB-Contour
Sound hasformula:
developed an
dB
Band-Limited
Pink
Noise
at
a
given
frequency
f =f =
0.17 dB
Band-Limited
Pink
Noise
at
a
given
frequency
0.17 ++ 20
20∗∗log(Rb(f))
log(Rb(f))
additional input source for MAPP called B-Noise.
dB Band-Limited Pink Noise at a given frequency
where:
where:
dB Band-Limited Pink Noise at a given frequency f = 0.17 + 20 ∗ log(Rb(f)) where:
where:
! !∗
! f!
12200
∗
f
12200
!
!
f = !
∗f
= Rb
Rb f Rb
! 12200
! + 12200
! + 158.5! !.!
= f ! + 20.6
!
! +f 12200
! ! f ! f+
!
! !.!
f !f +
20.6
12200
158.5! !.!
f + 20.6! f f ! +
f ! + 158.5
the result:
Giving Giving
the result:
Giving the result:
Band-Limited Pink Noise (B)
Band-Limited Pink Noise (B)
Band-Limited Pink
Noise (B)
Band-Limited Pink
Noise (B)
16
20
25
31
39
50
63
79
99
125
157
198
250
315
397
500
630
794
1000
1260
1587
2000
2520
3175
4000
5040
6350
8000
10079
12699
16000
6
0
-6
-12
-18
-24
-30
-36
dB
Band-Limited Pink
Noise (B)
Frequency
The above graph indicates that B-Noise has less spectral content in the extreme
high frequencies and low frequencies than in the mid band. Now Meyer Sound
users will be able to view the Frequency
headroom of their systems from the perspective
of two different input signals. Here is the result of a B-Noise input:
16000
16
20
25
31 16
39 20
50 25
63 31
79 39
99 50
125 63
157 79
99
198 125
250 157
315 198
397 250
500 315
630 397
794 500
1000 630
1260 794
15871000
20001260
1587
25202000
31752520
40003175
50404000
63505040
80006350
100798000
10079
12699
12699
16000
6
0
-6
-12
-18
-24
-30
-36
dB
6
0
-6
-12
-18
-24
-30
-36
dB
Giving the result:
Band-Limited Pink Noise (B)
Frequency
The above graph indicates that B-Noise has less
spectral content
headroom of their systems from the perspective of two different
The
above
graphand
indicates
that B-Noise
lesssignals.
spectral content in the extreme
in the extreme
high
frequencies
low frequencies
than in hasinput
high
frequencies
and
low
frequencies
than
in
the
mid band. Now Meyer Sound
the mid band. Now Meyer Sound users will be able to view the
The above
thatthe
B-Noise
has of
less
spectral
content
in perspective
the extreme
usersgraph
will beindicates
able to view
headroom
their
systems
from the
of two different
inputfrequencies
signals.
Here
is
the
result
of
a
B-Noise
input:
high frequencies
and low
than
in
the
mid
band.
Now
Meyer
Sound
Here is the result of a B-Noise input:
users will be able to view the headroom of their systems from the perspective
of two different input signals. Here is the result of a B-Noise input:
UPQ B-Noise at 1m: A-weighted average = 114dB, Linear Peak SPL = 134dB
UPQ B-Noise at 1m: A-weighted average = 114dB, Linear Peak SPL = 134dB
UPQ B-Noise at 1m: 1/3 Octave Spectrum
A Weighted Average = 120 dB
Z Peak = 134 dB
UPQ B-Noise at 1m: A-weighted average = 114dB, Linear Peak SPL = 134dB
Real-World SPL
The Pink Noise and B-Noise SPL predictions in MAPP XT are
independently verifiable, and are intended to represent linear
reproduction levels of real-world signals lasting hours, as
opposed to test bursts lasting only a few milliseconds, which
are the basis of the Max Peak SPL specification.The inclusion of
2
B-Noise and Linear Peak SPL information in MAPP XT ensures
an accurate representation of our products’ capabilities. Meyer
Sound makes extremely powerful loudspeakers and wishes to
represent them with specifications based on repeatable, linear,
real-world measurements.
Copyright 2015, Meyer Sound Laboratories, Inc., All rights reserved.
18.908.202.01 A


