Student Activity: To investigate correlation and line of
advertisement

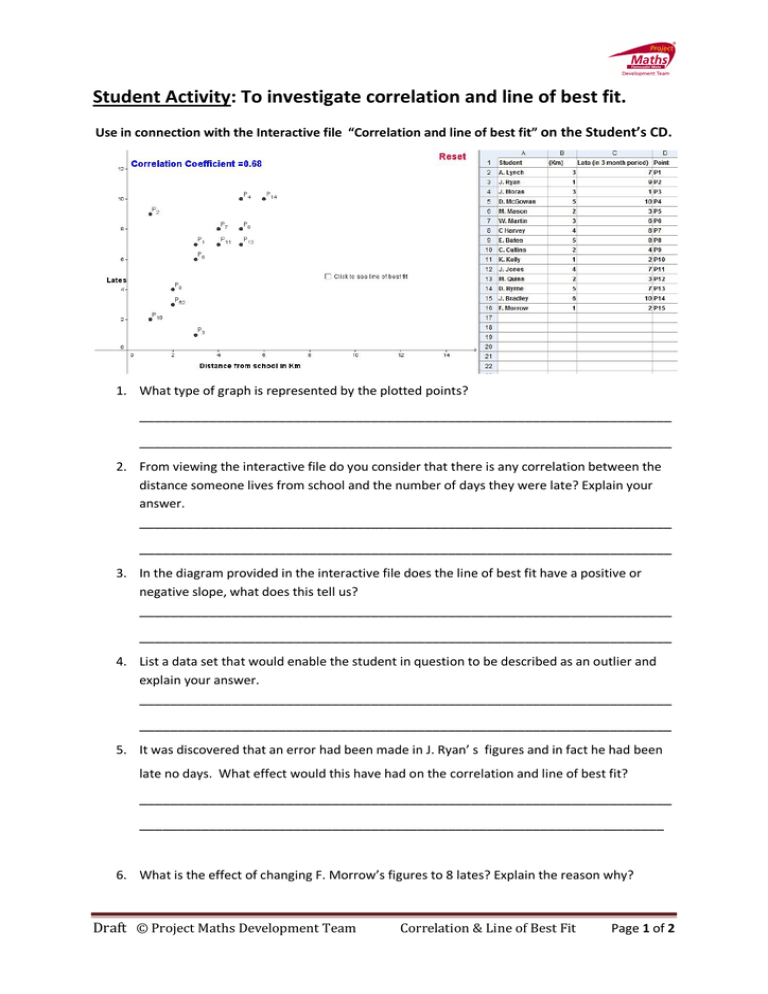
Student Activity: To investigate correlation and line of best fit. Use in connection with the Interactive file “Correlation and line of best fit” on the Student’s CD. 1. What type of graph is represented by the plotted points? _____________________________________________________________________ _____________________________________________________________________ 2. From viewing the interactive file do you consider that there is any correlation between the distance someone lives from school and the number of days they were late? Explain your answer. _____________________________________________________________________ _____________________________________________________________________ 3. In the diagram provided in the interactive file does the line of best fit have a positive or negative slope, what does this tell us? _____________________________________________________________________ _____________________________________________________________________ 4. List a data set that would enable the student in question to be described as an outlier and explain your answer. _____________________________________________________________________ _____________________________________________________________________ 5. It was discovered that an error had been made in J. Ryan’ s figures and in fact he had been late no days. What effect would this have had on the correlation and line of best fit? _____________________________________________________________________ ____________________________________________________________________ 6. What is the effect of changing F. Morrow’s figures to 8 lates? Explain the reason why? Draft © Project Maths Development Team Correlation & Line of Best Fit Page 1 of 2 _____________________________________________________________________ _____________________________________________________________________ 7. What is the effect of changing Harvey’s, Bates’s, Kelly’s and Byrne’s number of lates to zero? Explain your answer. What shape is the line of best fit now? _____________________________________________________________________ _____________________________________________________________________ 8. If all the points lay on the line of best fit, what is the correlation? _____________________________________________________________________ _____________________________________________________________________ 9. Give a reason, other than distance from the school that could explain why some students were late. _____________________________________________________________________ _____________________________________________________________________ Draft © Project Maths Development Team Correlation & Line of Best Fit Page 2 of 2


