A lab notebook handout
advertisement
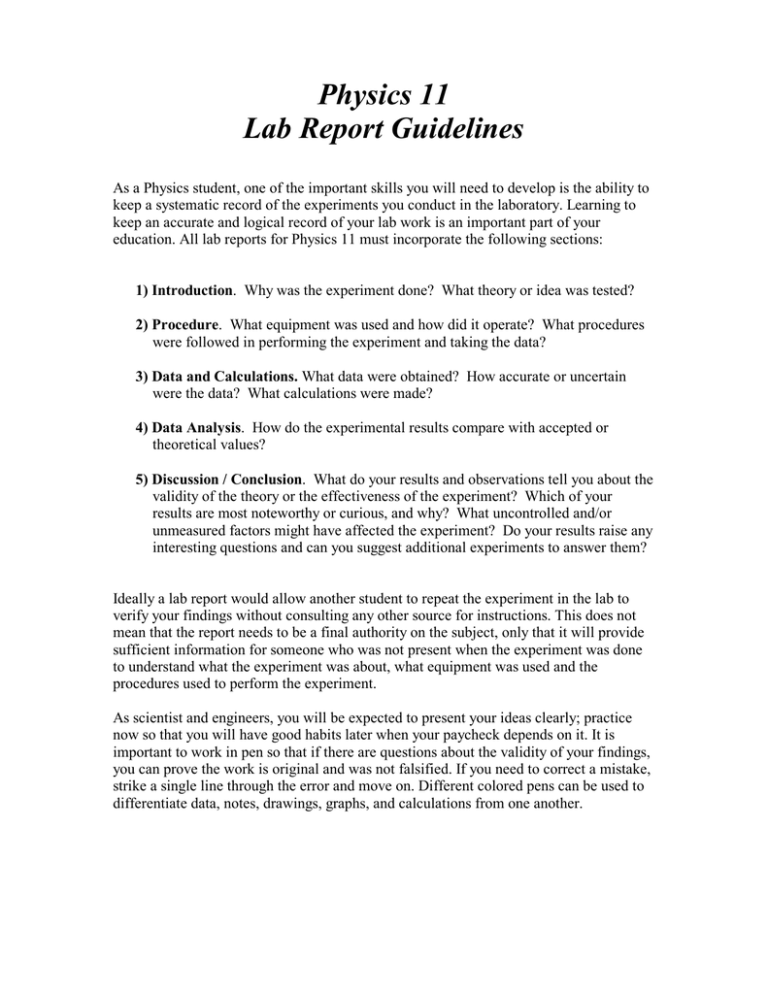
Physics 11 Lab Report Guidelines As a Physics student, one of the important skills you will need to develop is the ability to keep a systematic record of the experiments you conduct in the laboratory. Learning to keep an accurate and logical record of your lab work is an important part of your education. All lab reports for Physics 11 must incorporate the following sections: 1) Introduction. Why was the experiment done? What theory or idea was tested? 2) Procedure. What equipment was used and how did it operate? What procedures were followed in performing the experiment and taking the data? 3) Data and Calculations. What data were obtained? How accurate or uncertain were the data? What calculations were made? 4) Data Analysis. How do the experimental results compare with accepted or theoretical values? 5) Discussion / Conclusion. What do your results and observations tell you about the validity of the theory or the effectiveness of the experiment? Which of your results are most noteworthy or curious, and why? What uncontrolled and/or unmeasured factors might have affected the experiment? Do your results raise any interesting questions and can you suggest additional experiments to answer them? Ideally a lab report would allow another student to repeat the experiment in the lab to verify your findings without consulting any other source for instructions. This does not mean that the report needs to be a final authority on the subject, only that it will provide sufficient information for someone who was not present when the experiment was done to understand what the experiment was about, what equipment was used and the procedures used to perform the experiment. As scientist and engineers, you will be expected to present your ideas clearly; practice now so that you will have good habits later when your paycheck depends on it. It is important to work in pen so that if there are questions about the validity of your findings, you can prove the work is original and was not falsified. If you need to correct a mistake, strike a single line through the error and move on. Different colored pens can be used to differentiate data, notes, drawings, graphs, and calculations from one another. Physics 11 Lab Report Format Here is an outline of what a typical lab report should contain and the order it should be presented in: Title Page: Your Title page should include the title of the experiment, the date, your name and the names of your lab partners. Introduction: Your lab report should begin with a brief introduction (1 – 2 paragraphs) to what the lab is about, including explanations and/or background information on all concepts covered in the lab. You should state the purpose of the experiment and briefly explain the hardware and software that will be used to conduct the experiment. Present all necessary equations with explanation of each variable and the corresponding units. Procedure: The procedure should be a cohesive, sequential description of how the experiment was performed. Note: the procedure should not be copied verbatim from the lab handout; it should be a concise summary of the different steps involved in each experiment. Data: Tables: Data collected during the experiment should be shown in data tables within the body of the lab report. Tables should have columns that tell the readers not only what values they are looking at, such as “length” or “time” but also the units that correspond to the data. The instructor should be able to read the body of the report and easily identify all relevant values and their associated uncertainties. Graphs: The proper presentation of graphs requires various elements. The graph needs to be readable to the instructor. The scaling must be adequate to fully display the properties of the curve (i.e. the curve must cover the majority of the graph area), and all labels such as graph titles and axis labels must show quantities plotted with proper units. If curve fitting , such as a linear fit, is required, then the graph must also display the fitted equation along with the goodness of fit value. Data Analysis: This section should carefully show the calculations of your experimental results and of your theoretical predictions. Include one sample of EACH type of calculations performed in the lab. It is understood that most of the calculations will be done for you in Excel, but it should be realized that YOU must tell Excel the correct calculation to perform. Thus, one hand calculation must be turned in for each different type of calculation. Note that a sample calculation must show the equation symbolically, and then replace algebraic variables with numbers, and give the final answer. You must also include an uncertainty calculation if the data has an uncertainty associated with its value. After your experimental results and theoretical predictions are calculated, you must compare the two using proper error analysis techniques as discussed in lab (see Lab 1). Once proper error analysis is performed, briefly state whether or not your results agree with theory (you will expand upon this in the Conclusion). Discussion / Conclusion This is a very important part of the lab report. Summarize what you did in this experiment, what measurements were made and why. Your conclusion should restate the major findings of the experiment and how they compare to the theoretical predictions. Discuss whether or not you obtained meaningful results based on the objectives you outlined in the Introduction. Explain the sources of errors in this experiment and how they affected your results. You should also explain any significant problems you encountered and how these were resolved. The conclusion is not a personal reflection of your feelings about the lab, but should be a place to note possible sources of error in the experiment, how the findings verify or disprove the theory being tested and suggestions for future experiments that could explore the topic in greater detail. Note: You should use your data, graphs and calculations to support whatever conclusions are made here.
