Technical Note: Sequencing
Data Processing of Nextera® Mate Pair Reads
on Illumina Sequencing Platforms
Introduction
Mate pair sequencing enables the generation of libraries with insert
sizes in the range of several kilobases (Kb). As such, aligned mate pair
datasets can inform on genomic regions separated by larger distances
compared to traditional paired-end datasets. To produce these large
inserts, mate pair DNA libraries are generated using molecular biology
protocols that differ from those used to generate standard Illumina
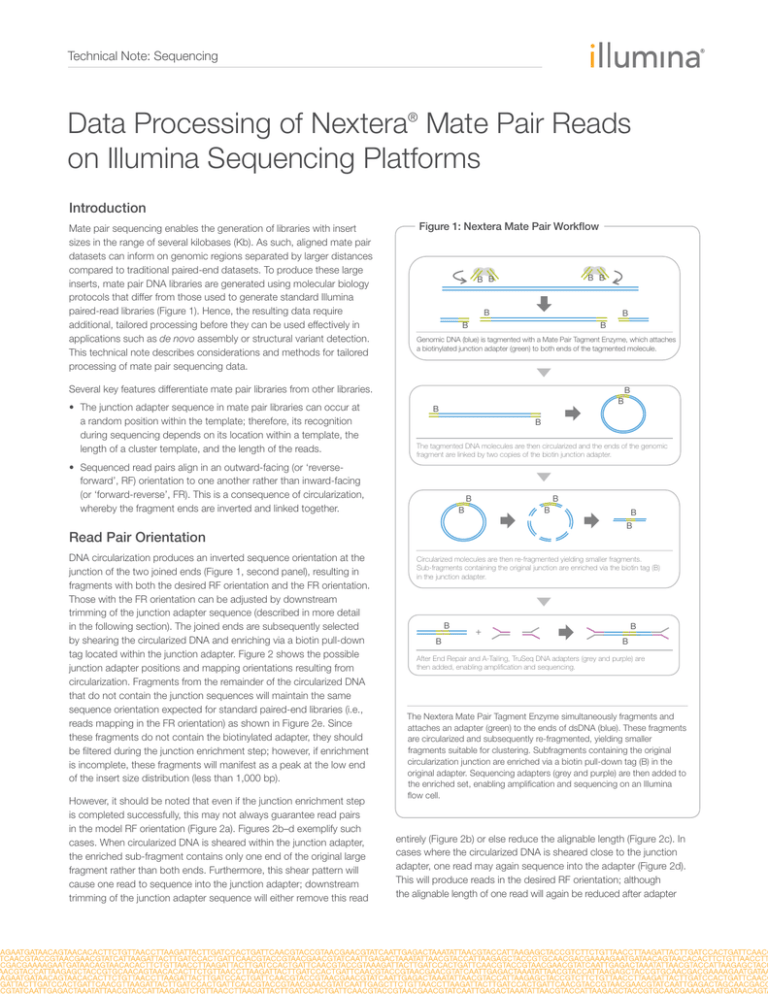
paired-read libraries (Figure 1). Hence, the resulting data require
additional, tailored processing before they can be used effectively in
applications such as de novo assembly or structural variant detection.
This technical note describes considerations and methods for tailored
processing of mate pair sequencing data.
Figure 1: Nextera Mate Pair Workflow
B B
B B
B
B
B
B
Genomic DNA (blue) is tagmented with a Mate Pair Tagment Enzyme, which attaches
a biotinylated junction adapter (green) to both ends of the tagmented molecule.
Several key features differentiate mate pair libraries from other libraries.
• The junction adapter sequence in mate pair libraries can occur at
a random position within the template; therefore, its recognition
during sequencing depends on its location within a template, the
length of a cluster template, and the length of the reads.
B
B
B
B
The tagmented DNA molecules are then circularized and the ends of the genomic
fragment are linked by two copies of the biotin junction adapter.
• Sequenced read pairs align in an outward-facing (or ‘reverseforward’, RF) orientation to one another rather than inward-facing
(or ‘forward-reverse’, FR). This is a consequence of circularization,
whereby the fragment ends are inverted and linked together.
B
B
B
B
Read Pair Orientation
DNA circularization produces an inverted sequence orientation at the
junction of the two joined ends (Figure 1, second panel), resulting in
fragments with both the desired RF orientation and the FR orientation.
Those with the FR orientation can be adjusted by downstream
trimming of the junction adapter sequence (described in more detail
in the following section). The joined ends are subsequently selected
by shearing the circularized DNA and enriching via a biotin pull-down
tag located within the junction adapter. Figure 2 shows the possible
junction adapter positions and mapping orientations resulting from
circularization. Fragments from the remainder of the circularized DNA
that do not contain the junction sequences will maintain the same
sequence orientation expected for standard paired-end libraries (i.e.,
reads mapping in the FR orientation) as shown in Figure 2e. Since
these fragments do not contain the biotinylated adapter, they should
be filtered during the junction enrichment step; however, if enrichment
is incomplete, these fragments will manifest as a peak at the low end
of the insert size distribution (less than 1,000 bp).
However, it should be noted that even if the junction enrichment step
is completed successfully, this may not always guarantee read pairs
in the model RF orientation (Figure 2a). Figures 2b–d exemplify such
cases. When circularized DNA is sheared within the junction adapter,
the enriched sub-fragment contains only one end of the original large
fragment rather than both ends. Furthermore, this shear pattern will
cause one read to sequence into the junction adapter; downstream
trimming of the junction adapter sequence will either remove this read
B
B
Circularized molecules are then re-fragmented yielding smaller fragments.
Sub-fragments containing the original junction are enriched via the biotin tag (B)
in the junction adapter.
B
B
+
B
B
After End Repair and A-Tailing, TruSeq DNA adapters (grey and purple) are
then added, enabling amplification and sequencing.
The Nextera Mate Pair Tagment Enzyme simultaneously fragments and
attaches an adapter (green) to the ends of dsDNA (blue). These fragments
are circularized and subsequently re-fragmented, yielding smaller
fragments suitable for clustering. Subfragments containing the original
circularization junction are enriched via a biotin pull-down tag (B) in the
original adapter. Sequencing adapters (grey and purple) are then added to
the enriched set, enabling amplification and sequencing on an Illumina
flow cell.
entirely (Figure 2b) or else reduce the alignable length (Figure 2c). In
cases where the circularized DNA is sheared close to the junction
adapter, one read may again sequence into the adapter (Figure 2d).
This will produce reads in the desired RF orientation; although
the alignable length of one read will again be reduced after adapter
Technical Note: Sequencing
Figure 2: Junction Adapter Positions and Mapping Orientations
Mapping orientation
Read 1
a)
RF
Read 1
Read 2
b)
Read 1
Read 2
c)
FR
Read 1
Read 2
d)
RF
Read 1
Read 2
e)
FR
Read 2
Composition of example library templates from a mate pair experiment. For each example (a–e), the position of the junction adapter sequence is shown in green and
the mapping orientation (either FR or RF, ‘forward-reverse’ and ’reverse-forward’, respectively) of the resulting read pairs is shown to the right. Sections of genomic
DNA sequence are shown in blue and the TruSeq adapter sequences are shown in purple and grey.
Amplification/sequencing primer adapters are shown in grey and purple.
Table 1: Mate Pair Adapter Sequence Elements
Adapter Element
Circularized Duplicate Junction Adapter
Circularized Single Junction Adapter
Circularized Single Junction Adapter Reverse Complement
Sequence
CTGTCTCTTATACACATCTAGATGTGTATAAGAGACAG
CTGTCTCTTATACACATCT
AGATGTGTATAAGAGACAG
Read 1 External Adapter
GATCGGAAGAGCACACGTCTGAACTCCAGTCAC
Read 2 External Adapter
GATCGGAAGAGCGTCGTGTAGGGAAAGAGTGT
trimming. However, in most cases, the circularized DNA fragments are
sheared such that the resulting paired reads will align in the desired RF
orientation and will not require junction adapter trimming.
Adapter Trimming
The junction adapter sequence (Table 1) originates from the Mate Pair
Tagment Enzyme used to fragment the input DNA (Figure 1). In most
cases, this sequence is appended to both ends of the DNA fragment
and therefore is duplicated in an FR orientation during circularization
(Table 1, adapter element 1). Less frequently, the adapter is only
appended to one end of the DNA fragment, and the post-circularization
sequence appears singly (Table 1, adapter elements 2–3).
In addition to these adapter sequences, the templates also contain
external adapter sequences used in cluster amplification and
hybridization of the sequencing primers (Table 1, adapter elements
4–5). As with standard paired-end library templates, sequencing reads
may reach beyond the genomic insert and junction adapter sequence
and extend into the external adapter sequence. The likelihood of this
occurrence depends on the experimental read length as well as on the
length of the final library template.
External adapters must be considered in the alignment process. If
they are ignored, the number of reads that successfully align to the
reference genome will decrease. For example, a read containing the
junction adapter sequence has a very low probability of alignment
since that sequence is exceedingly rare in genomic DNA. In cases
where an aligner is able to align such a read, the resulting alignment
will have a large edit distance, leading to increased mismatch rates
and indel error rates.
For these data to be analyzed effectively, the adapter sequences
are trimmed prior to alignment. The final orientation of the read pair
depends on the location of the adapter sequence within the read
and on the applied trimming strategy. Two trim strategies commonly
employed are:
1. If the adapter occurs toward the 5’ end of the read (Figure 2c), the
read sequence after the adapter is kept. Together with its partner
this will yield paired-end reads in an FR orientation.
2. If the adapter occurs towards the 3’end of the read (Figure 2d), the
read sequence before the adapter is kept. Together with its partner
this will yield mate pair reads in an RF orientation.
When correctly oriented mate pairs are sought, it may be preferable to
Technical Note: Sequencing
As described above, the junction adapter may appear in one of three
forms (Table 1, adapter elements 1–3). Therefore, two rounds of
adapter trimming must be performed, first trimming the single adapter
and then its reverse complement (Table 1, adapter elements 2–3
respectively). This process will also comprehensively trim the duplicate
junction adapter sequence as well. If external adapter sequence is
present within a read, then the trimming process described above is
optional. This is because reads containing external adapter sequence
have a very low probability of alignment or assembly. In most cases, it is
therefore preferable to throw out read pairs that contain external adapter
sequence, thus saving time during the alignment or assembly process.
In order for trimming to be effective, the software tools used to perform
read trimming must also be able to trim partial adapters. Examples
of tools that can perform partial adapter trimming include Biopieces1
and adapterremoval2. Both tools will trim one or more adapters from
either the 3’ or 5’ end of the read, though neither has the option of
trimming from the end closest to the junction adapter. Ideally, the tool
used for adapter trimming should also allow for potential sequencing
errors in the adapter sequence. The degree to which mismatches are
allowed will depend on the length of the adapter and on the desired
sensitivity in identifying the adapter sequence. For example, a stringent
mismatch setting (e.g., requiring zero mismatches) may cause the
trimming algorithm to miss some of the adapter sequences; while a
looser mismatch setting may cause the trimming algorithm to identify
and trim sequences that do not originate from the adapter.
Secondary Analysis
Commercially-available secondary analysis tools such as Novoalign3
and CLC Genomics Workbench4 are able to analyze read pairs in an
RF orientation. Certain open source tools such as BWA5, used for
alignment, and Velvet6, used for de novo assembly, require the paired
reads to be in an FR orientation. For these latter tools, read pairs in the
RF orientation must be reverse complemented prior to alignment or
assembly. If the sequence data contains a mixture of RF and FR pairs,
then only the RF pairs should be reverse complemented.
If performing de novo assembly using Velvet and trimming from
the end of the read closest to the internal adapter (i.e., per-read
trimming to preserve the longest possible fragment), it is conventional
to separate the reads pairs that are trimmed according to strategy
Ecoli
1600
Number of fragments
1400
1200
1000
800
600
400
200
0
0
2000
4000
6000
8000
10000
Insert size
5000
The insert size distribution of an E. coli K-12 MG1655 mate pair library
sequenced4500
on the MiSeq® platform. The insert size per read pair was
calculated after aligning the data to the reference genome using BWA.
4000
Histogram summary statistics were calculated across all values. The
3500size was 3,125 bp.
median insert
Reference position (thousands)
An alternative trimming approach is to apply either (1) or (2) on a
per-read basis such that longest possible fragment is preserved.
This is achieved by trimming from the end of the read closest to the
junction adapter, resulting in a set of read pairs with both RF and
FR orientations. Reads with an FR orientation will have an insert
size distribution with a mean less than 1 Kb. This subset should be
segregated during adapter trimming and aligned separately unless an
aligner is used that can handle reads pairs with differing orientations
and insert size distributions.
Figure 3: E. coli Mate Pair Library
Insert Size Distribution
3000
2500
(1) versus strategy
(2) into separate fastq files. Each fastq file can
2000
then be passed separately to Velvet for assembly via command line
1500
arguments, ‘-shortPaired -fastq strategy1.fastq -shortPaired2 -fastq
1000
strategy2.fastq’. Velvet makes use of the insert size distribution of
500
each fastq file
during the assembly process. Since the FR reads
0
defined by strategy
(1) have a lower mean insert size than the RF reads
0
500 1000 1500 2000 2500 3000 3500 4000 4500
defined by strategy
(2),
passing them simultaneously in a single fastq
Assembly
position
(thousands)assembly.
file would confound the algorithm
and result
in a suboptimal
This topic is addressed in more detail in the Velvet user manual7.
Most de novo assemblers are based on the manipulation of de
Bruijn graphs. Simply, this approach involves breaking reads into
smaller pieces, known as k-mers (where k denotes its length in
bases), in order to reduce the computational load of assembly. To
achieve80000
contiguous de novo assemblies, long k-mers are crucial.
70000 trimming, the average read length of a paired 100 bp
After adapter
60000
run is approximately
90 bp. The maximum k-mer length is obviously
bounded
by
the
read
length; for trimmed 90 bp reads, reasonable
50000
k-mers 40000
sizes are between 55 and 60 bp for a bacterial genome. The
k-mer size is a configurable parameter in most assembly tools; so it is
30000
reasonable to try several k-mer sizes and choose the assembly that
20000
offers an optimal combination of scaffold sizes and assembly errors.
10000
Tools such
as VelvetOptimiser8 automate the process of choosing the
0 size.
optimal k-mer
Number of fragments
trim only as described in (2) above. This will result in all trimmed reads
having the desired RF orientation. Even when the adapter is located
at or within a few bases of the 5’ end of the read—as described in
(1) above—trimming strategy (2) can still be employed. However, the
resulting sequence will contain all or mostly adapter sequence and
may not align. Thus trimming only as described in (2) will result in a
slight decrease in data yield, but will ensure that aligned read pairs
maintain the desired RF orientation.
0
2000
4000
6000
8000
10000
Example Applications of Mate Pair Data
Insert size
The following data generated by E. coli and human samples
demonstrate that Nextera mate pair libraries support both small and
complex genomes.
De Novo Assembly of E. coli K-12 MG1655 Genome
Nextera mate pair library sequencing allows the user to tune the
experimental insert size distribution of the reads, meaning that read
pairs from the same experiment can offer both long-range and shortrange sequence information. The ultimate effect of this additional
information is improved de novo assemblies.
5000
Number of fragments
1400
Technical Note: Sequencing
1200
1000
800
600
400
200
Table 2: Assembly Summary Statistics
from an E. coli Mate Pair Library Run
Figure 4: Dot Plot of E. coli Assembly Aligned
0
to the
Reference
Genome6000
0
2000
4000
8000
10000
Insert size
Size (bp)
Genome Size
4,630,577
N50 (Scaffold)
4,617,839
Max Scaffold Size
4,617,839
N50 (Contig)
170,901
MaxContig Size
432,335
5000
Reference position (thousands)
Assembly Metric
Assembly summary statistics from a 2 × 150 bp E. coli K-12 MG1655
mate pair library sequenced on the MiSeq platform.
4500
4000
3500
3000
2500
2000
1500
1000
500
0
0
Table 3: Assembly Summary Statistics from
Combined Mate Pair and Paired-End Runs
1000 1500
2000 2500 3000
3500 4000
4500 5000
Assembly position (thousands)
Mate Pair
Paired-End
Mean Coverage
280.2
1805
Number of Bases
< 8× Coverage
4
20,964
% Mismatches
0.63%
0.20%
% Indels
0.02%
0.00%
% Aligned Bases > Q30
82.59%
85.61%
Assembly summary statistics from a 2 × 150 mate pair library and a 2 × 250
standard paired-end library of E. coli K-12 MG1655 sequenced on a MiSeq
instrument. The additional information offered by long-range mate pairs allows
much higher coverage of the reference genome. When assessing coverage,
reads with mapping quality score (MAPQ) less than 1 were filtered from analysis.
To demonstrate the use of mate pair libraries for de novo assembly,
the genome of E. coli K-12 MG1655—a laboratory strain of bacteria
used to benchmark many NGS applications—was assembled. A
MG1655 library was generated as described in the Nextera Mate Pair
Sample Preparation User Guide (PN 15035209)9. Each mate pair read
was sequenced on the MiSeq platform for 150 cycles resulting in a
total of 300 bases of sequencing data per mate pair library. Total data
yield was 1.8 Gb of raw data, the median insert size was 3,125 bp,
and the insert size distribution is shown in Figure 3.
Prior to performing de novo assembly, the data were pre-processed
as follows. In short, the adapters were trimmed and the RF reads were
reverse complemented. Additionally, the data were randomly downsampled to 500 Mb so as to limit the mean coverage to 50–100×,
thereby reducing the computational requirements of the assembler.
The VelvetOptimiser software was used for assembly. The optimal
k-mer size was 99 bp. Summary statistics for the assembly are shown
in Table 2.
To confirm the consistency of the scaffolded assembly with the
reference genome, a dot plot was constructed comparing the
alignment of the scaffold to the reference genome (Figure 4). Dot plots
similar to the one shown in Figure 4 can be generated with tools such
as MUMmer10. The plot shows that the assembled scaffold correlates
perfectly with the reference genome. The observed discontinuity (i.e.,
two lines) between the position of the assembly and the reference is
Dot plot of an E. coli K-12 MG1655 mate pair assembly aligned to the
reference genome. The assembled genome shows high correlation to the
reference, indicated by the diagonal line. The appearance of two distinct
lines is due to the circular structure of the E. coli genome.
80000
70000
Number of fragments
Application
500
60000
Table 4: Alignment Summary Statistics from
a Human Mate Pair Sequencing Run
50000
40000
30000
Metric
Mate Pair Result
20000
Mean Coverage
10000
0
%
Coverage >8×
0
2000
% Mismatches
15.70
4000
6000
Insert size
8000
10000
92.04%
0.46%
% Indels
0.03%
% Aligned Bases >Q30
92.04%
Alignment summary statistics from a Human NA12877 mate pair library,
run at 2 × 100 on a MiSeq instrument.
due to the circular genome structure of E. coli; that is, the first base
in the assembled scaffold is unlikely to align with the first base of
the reference genome because the first position in the assembly is
arbitrarily selected.
To further assess run quality, E. coli read pairs were aligned to the
reference genome using BWA. This alignment was then compared
to the alignment generated from a standard 2 × 250 bp pairedend MiSeq run. The results are summarized in Table 3. To assess
coverage, reads having a mapping quality score (MAPQ) less than 1
were filtered out. Due to the additional information offered by longrange mate pair reads, the percentage of the genome having unique
coverage is significantly improved, as demonstrated by the 5000×
reduction in the number of bases with coverage below 8×.
Sequencing of A Human NA12877 Sample
A Nextera mate pair library of a human male (NA12877) sample was
sequenced on the HiSeq 2500 platform for 2 × 100 cycles and aligned
using BWA. The raw data yield was 67 Gb, and the aligned yield was
45 Gb, corresponding to a mean coverage of approximately 16×. The
loss in aligned yield is primarily due to adapter trimming. The median
500
0
0
500
1000 1500
2000 2500 3000
3500 4000
4500 5000
Assembly position (thousands)
Technical Note: Sequencing
Figure 5: Human NA12877 Mate Pair Library
Insert Size Distribution
paired-end data having an average insert size of 300 bp. Coverage
of the mixed dataset was then compared to that of the paired-end
data alone, with both datasets sampled to the same coverage
depth of approximately 31×. Coverage was further evaluated across
interspaced repeat regions in chromosome 21. Repeat regions are
notoriously difficult to cover because aligners identify multiple locations
to which the paired-end reads may align. Analysis was restricted to
LINEs (Long Interspersed Nuclear Elements, a type of repeat region
ranging from 0.1 Kb to 28 Kb) greater than 2 Kb in length. The results,
summarized in Table 5, demonstrate superior coverage by the mixed
dataset over paired-end data alone.
80000
Number of fragments
70000
60000
50000
40000
30000
20000
10000
0
0
2000
4000
6000
8000
10000
Insert size
Insert size distribution of a 2 × 100 bp Human NA12877 mate pair library
on a HiSeq® 2500 platform. The insert size per read pair was calculated after aligning the data to the hg19 reference genome using BWA. Histogram
summary statistics were calculated across all values. The median insert size
was 3,400 bp.
Summary
Mate pair library sequencing can provide detailed information about
genomic regions that are separated by large distances. In order
to efficiently analyze data from Illumina mate pair libraries, tailored
processing of mate pair sequencing data is necessary based on the
unique features of these libraries.
References
1. code.google.com/p/biopieces
2. code.google.com/p/adapterremoval
3. www.novocraft.com
Table 5: Coverage Results from a Mixed Data Set
4. www.clcbio.com
5. bio-bwa.sourceforge.net
6. www.ebi.ac.uk/~zerbino/velvet
Mate Pair/
Paired-End
Results
Paired-End
Only Results
31×
31×
% Coverage > 8×
98.08%
97.96%
% Coverage > 8×
(chr21 LINEs >2 kb)
99.52%
98.78%
Metric
Mean Coverage
7. helix.nih.gov/Applications/velvet_manual.pdf
8. bioinformatics.net.au/software.velvetoptimiser.shtml
9. Nextera Mate Pair Sample Prep User Guide, available at my.illumina.com
10. mummer.sourceforge.net
Coverage results from a mixed dataset of mate pair and paired-end reads versus a
dataset containing paired-end reads only after alignment to the hg19 reference genome.
insert size of the data was approximately 3,400 bp with an insert size
distribution as shown in Figure 5. Summary statistics for the alignment
are listed in Table 4.
The insert size per read pair was calculated after aligning the data
to the hg19 reference genome using BWA. Histogram summary
statistics were calculated across all values. The median insert size was
3,400 bp, and 2,241,426 read pairs contained an insert size greater
than 10 Kb.
One useful application of mate pair sequencing is supplementation of
paired-end data in order to provide sequence depth of regions that
are traditionally difficult to cover. To demonstrate the efficacy of this
approach, the mate pair data was mixed in a 1:1 ratio with 2 × 100
Illumina • 1.800.809.4566 toll-free (U.S.) • +1.858.202.4566 tel • techsupport@illumina.com • www.illumina.com
For research use only
© 2012 Illumina, Inc. All rights reserved.
Illumina, IlluminaDx, BaseSpace, BeadArray, BeadXpress, cBot, CSPro, DASL, DesignStudio, Eco, GAIIx, Genetic Energy,
Genome Analyzer, GenomeStudio, GoldenGate, HiScan, HiSeq, Infinium, iSelect, MiSeq, Nextera, NuPCR, SeqMonitor, Solexa,
TruSeq, VeraCode, the pumpkin orange color, and the Genetic Energy streaming bases design are trademarks or registered
trademarks of Illumina, Inc. All other brands and names contained herein are the property of their respective owners.
Pub. No. 770-2012-053 Current as of 17 December 2012


