Pump and engine performance
curves are important tools in the design
and analysis of pumping stations. The
pump curve provides information on
the pump’s ability to produce head and
flow capacity along with information
on pump efficiency and brake
horsepower requirements. The engine
performance curve will help insure
proper loading of the engine to obtain
the best possible fuel economy.
Pump Performance Curve
Reading Pump
and Engine
Performance
Curves
Danny H. Rogers
Extension Irrigation Engineer
Mahbub Alam
Extension Agricultural Engineer,
Southwest Research Extension Center
Kansas State University
Agricultural Experiment Station and
Cooperative Extension Service
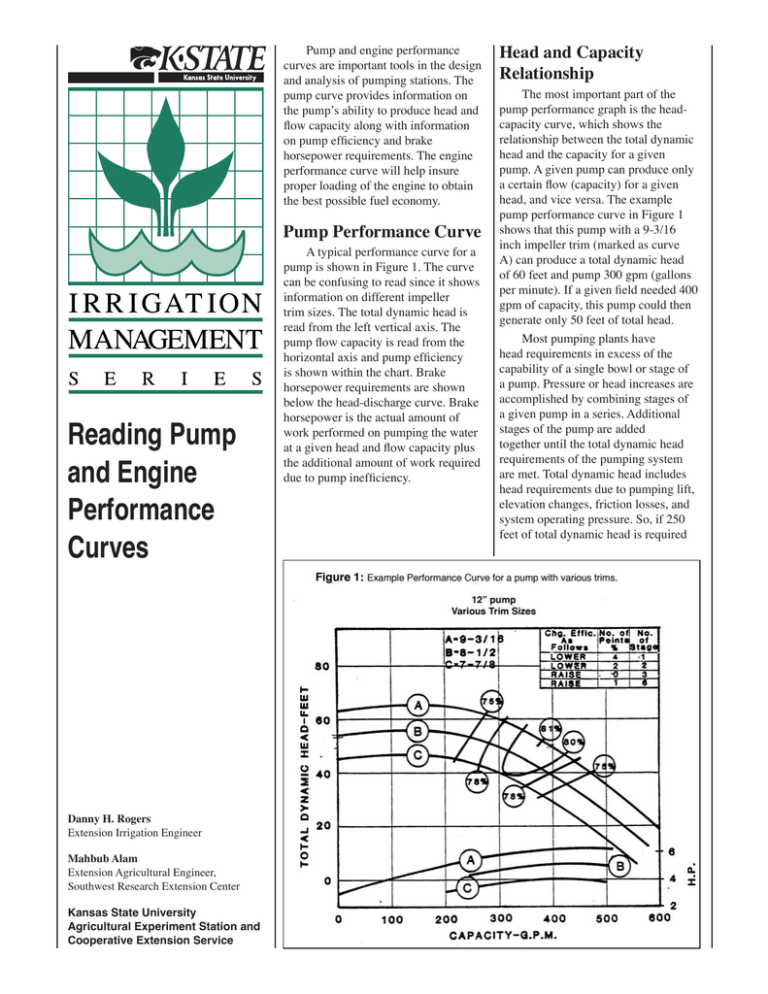
A typical performance curve for a
pump is shown in Figure 1. The curve
can be confusing to read since it shows
information on different impeller
trim sizes. The total dynamic head is
read from the left vertical axis. The
pump flow capacity is read from the
horizontal axis and pump efficiency
is shown within the chart. Brake
horsepower requirements are shown
below the head-discharge curve. Brake
horsepower is the actual amount of
work performed on pumping the water
at a given head and flow capacity plus
the additional amount of work required
due to pump inefficiency.
Head and Capacity
Relationship
The most important part of the
pump performance graph is the headcapacity curve, which shows the
relationship between the total dynamic
head and the capacity for a given
pump. A given pump can produce only
a certain flow (capacity) for a given
head, and vice versa. The example
pump performance curve in Figure 1
shows that this pump with a 9-3/16
inch impeller trim (marked as curve
A) can produce a total dynamic head
of 60 feet and pump 300 gpm (gallons
per minute). If a given field needed 400
gpm of capacity, this pump could then
generate only 50 feet of total head.
Most pumping plants have
head requirements in excess of the
capability of a single bowl or stage of
a pump. Pressure or head increases are
accomplished by combining stages of
a given pump in a series. Additional
stages of the pump are added
together until the total dynamic head
requirements of the pumping system
are met. Total dynamic head includes
head requirements due to pumping lift,
elevation changes, friction losses, and
system operating pressure. So, if 250
feet of total dynamic head is required
with a desired pumping rate of 400
gpm, then five stages of this pump
would be required. Adding stages
increases pressure; it does not increase
flow capacity. If capacity were to be
changed significantly, the selection of
a different pump would be required.
Pumps are generally selected
so that the operating point on the
performance curve is to the right of
the peak efficiency point. Any declines
in groundwater and normal wear
processes would then tend to push
the pump towards higher efficiency,
resulting in better performance over
a larger period of time than if the
original selection was to the left of
maximum efficiency.
Efficiency
The pump performance curve also
gives information on pump efficiency.
The efficiency curves intersect with
the head-capacity curve and are
labeled with percentages. Each pump
will have its own maximum efficiency
point. Figure 1 shows this pump’s
maximum efficiency is 81 percent for
operating conditions of approximately
380 gpm with impeller trim A. When
operating at 300 gpm and 60 feet of
head, efficiency is approximately 78
percent. When operating at 50 feet of
total head and 400 gpm efficiency is
approximately 80.5 percent.
The pump performance curve also
features an efficiency adjustment chart
to account for changes in efficiency
that occur as the number of stages
change. Pump efficiency improves
with additional stages since the
friction losses that occur are shared.
If only a single stage pump is used
then this example efficiency chart
indicates the pump efficiency read
from the chart should be reduced by 4
percent. When three stages are used,
the readings can be taken directly from
the chart. When six stages are used,
chart readings can be increased by 1
percent. Some manufacturers record
efficiency on the chart for single stage
pumps and give increases with stages.
Others do as shown in this example.
Brake Horsepower
The pump performance curve
will give information on the brake
horsepower required to operate
a pump at a given point on the
performance curve. The brake
horsepower curves run across the
bottom of the pump performance
curve. Like the head-capacity curve,
there is a brake horsepower curve
for each different impeller trim.
Continuing with the previous example,
a pump with an impeller trim A
operating at 50 feet of head and 400
gpm would require approximately 6.2
horsepower. The addition of stages
increases horsepower by an equal
amount.
with trim A operating at 1770, 1470,
and 1170 rpm. The curve lines marked
A in Figures 1 and 2 are identical. The
general effect of reducing speed is a
reduction of capacity and head. Pump
efficiency can be unaffected with
head and capacity changes if the new
pumping conditions are proportional
to the speed changes. However, most
often a specific head or discharge
is required that forces the pump to
operate at some other point in the
curve. This means efficiency will be
changed.
The manufacturer cannot be
expected to provide a performance
curve for every conceivable operating
speed and trim. The effect of speed
and trim changes can be determined
through the use of mathematical
relationships, sometimes known as
affinity laws. However since the trim
of the pump cannot be easily altered
after installation, only the affinity laws
for speed will be discussed.
The affinity law associated with
the rotational speed or rpm of a pump
is that discharge is proportional to
the ratio of rotational speed; head
is proportional to the square of the
rotational speed ratio; and brake
horsepower (BHP) is proportional to
the cube of the rotational speed ratio.
These relationships can be stated
Impeller Trims
Pump performance curves
generally show performance for
various impeller diameters or trims.
Manufacturers will put several
different trim curves on a pump
performance curve to make pump
specification easier, although
this sometimes makes the pump
performance curve more difficult to
read.
Operating Speed
Occasionally manufacturers will
provide pump performance curves
that will show the effect of changing
operating speed or rpm. Figure 2
shows the same 12-inch pump model
Equations 1, 2 and 3 and Examples
1) Final Discharge =
2) Final Head =
3) Final BHP =
(
(
1) Final Discharge =
2) Final Head =
3) Final BHP =
(
(
(
)
Final RPM
Initial RPM
)
Final RPM
Initial RPM
(
)
Final RPM
Initial RPM
1470
1770
1470
1770
1470
1770
)
)
3
2
3
)
2
× Initial Discharge
x Initial Head
x Initial BHP
× 400 = 332 gpm
x 50 = 34.5 feet
x 6.2 = 3.4 BHP
Engine Performance
Curve
Engine performance curves can
also be obtained. Anybody with a new
pumping plant installation should
request a copy of the performance
curves for the pump and engine and
be certain the gear head ratio is clearly
marked on the unit and recorded with
the performance curves. The irrigator
is then in a much better position to
evaluate the effects of system changes
or water declines on pumping plant
efficiency.
A typical engine performance
curve or map is shown in Figure 3.
The horizontal axis shows percent of
rated engine speed. The left vertical
axis is the percent of rated torque.
The intersection of 100 percent rated
torque and speed is the maximum
rated power for the engine. In this
example, 100,75, 50 and 25 percent
of rated power is plotted. On Figure
3, points A and B are plotted along
the 50 percent rated power curve.
This illustrates that the same power
output can be achieved using various
combinations of speed and torque.
Imposed on the power curves are
lines that are lines of equal fuel
consumption. For a given engine, the
lines would be labeled with values
using units such as pounds of fuel
per horsepower–hour, or gallons per
horsepower–hour, kilograms per kilowatt hour, or so forth. In this example
case, these values were replaced with
percent of minimum fuel use. The
point labeled 100 percent is the area of
best fuel economy.
Effects of Rotational
Speed Changes on Engine
Performance
mathematically as shown in Equations
1, 2 and 3 at left.
These relationships could be used
to develop Figure 2 using information
from Figure 1. For example, at rated
speed (1770 rpm) and impeller curve
A, the pump curve shows 50 feet of
head can be developed at a discharge
of 400 gpm with a pump efficiency
of 80.5 percent. Brake horsepower
requirements are 6.2 hp. If pump
speed is slowed to 1470 rpm, what is
the effect on pumping characteristics?
Solution:
Use equations 1, 2 and 3 as shown
in the examples at left. The reduction
of the operating speed results in the
flow capacity being reduced to 332
gpm, the head to 34.5 feet and the
brake horsepower to 3.4bhp.
The results can be compared to
values read from Figure 2 to see that
the relationships are valid.
Examination of points A and B
from Figure 3 illustrate that the engine
at point A is operating at much better
fuel economy that at point B. If this
situation were a tractor, operator
response would be to gear up and
throttle down. With a fixed gear head,
this would require changing of the
gear head at considerable expense.
With pump and engine
performance curves, the effect of
changing pump speed to accommodate
new pumping conditions with the
same equipment may be estimated
without extensive field testing or
discovery of excessive fuel use
during or after the irrigation season.
Changing speed to accommodate
changes in pumping conditions can
result in pumping water at very low
efficiency. Worse case situations
result in decreased water availability
and increased pumping costs,
although occasionally some changes
can improve pumping efficiency.
However, since irrigation fuel costs
can represent a significant production
expense, any changes in operating
conditions should be analyzed in order
to make certain profitability is not
sacrificed.
Summary
Many factors affect the overall
performance of irrigation pumping
plants. All changes influence
performance; however, many changes
are not evaluated in terms of pumping
costs and irrigation capacity unless
the effects are severe enough to have
an immediate and noticeable impact.
Loss of pumping efficiency and
capacity are common with increasing
head requirements. Evaluation of this
loss should be done to see if other
adjustments or equipment investments
would be economically beneficial.
Additional Information
Sources:
L885.Evaluating Pumping Plant
Efficiency Using On-Farm Fuel Bills.
MF2360. Comparing Irrigation
Energy Cost.
FuelCost. A software program to
estimate irrigation pumping plant
efficiency. Available via the Mobile
Irrigation Lab Web site at
www.oznet.ksu.edu/mil
References:
Nebraska Performance Criteria (NPC)
for Pumping Plants
Acknowledgement:
This material is supported in part
by Kansas Water Plan funds through
the Kansas Water Office and USDA
Project 05-34296-15666 and the
Ogallala Initiative.
Brand names appearing in this publication are for product identification purposes only. No endorsement is intended,
nor is criticism implied of similar products not mentioned.
Publications from Kansas State University are available on the World Wide Web at: www.oznet.ksu.edu
Contents of this publication may be freely reproduced for educational purposes. All other rights reserved. In each case, credit
Dan Rogers and Mahbub Alam, Reading Pump and Engine Performance Curves, Kansas State University, July 2006.
This material is supported in part by Kansas Water Plan funds through the Kansas Water Office
and USDA Project 05-34296-15666 and the Ogallala Initiative.
Kansas State University Agricultural Experiment Station and Cooperative Extension Service
L886 rev.
July 2006
K-State Research and Extension is an equal opportunity provider and employer. Issued in furtherance of Cooperative Extension Work, Acts of May 8 and June
30, 1914, as amended. Kansas State University, County Extension Councils, Extension Districts, and United States Department of Agriculture Cooperating,
Fred A. Cholick, Director.


