APA: TABLES AND FIGURES
advertisement

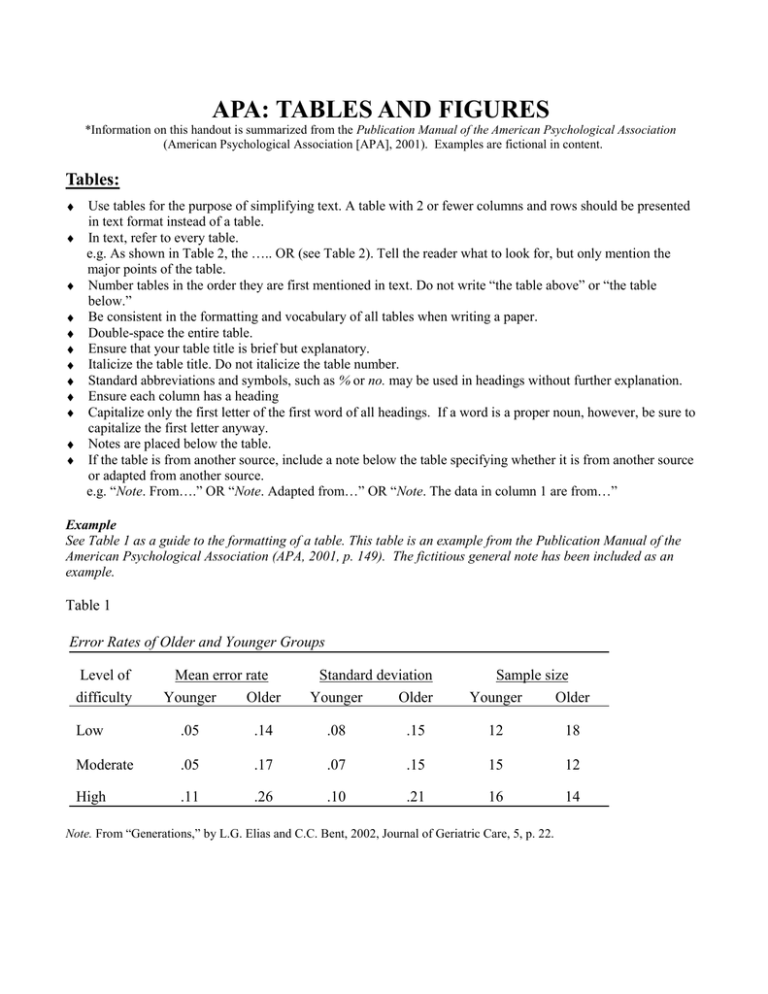
APA: TABLES AND FIGURES *Information on this handout is summarized from the Publication Manual of the American Psychological Association (American Psychological Association [APA], 2001). Examples are fictional in content. Tables: Use tables for the purpose of simplifying text. A table with 2 or fewer columns and rows should be presented in text format instead of a table. In text, refer to every table. e.g. As shown in Table 2, the ….. OR (see Table 2). Tell the reader what to look for, but only mention the major points of the table. Number tables in the order they are first mentioned in text. Do not write “the table above” or “the table below.” Be consistent in the formatting and vocabulary of all tables when writing a paper. Double-space the entire table. Ensure that your table title is brief but explanatory. Italicize the table title. Do not italicize the table number. Standard abbreviations and symbols, such as % or no. may be used in headings without further explanation. Ensure each column has a heading Capitalize only the first letter of the first word of all headings. If a word is a proper noun, however, be sure to capitalize the first letter anyway. Notes are placed below the table. If the table is from another source, include a note below the table specifying whether it is from another source or adapted from another source. e.g. “Note. From….” OR “Note. Adapted from…” OR “Note. The data in column 1 are from…” Example See Table 1 as a guide to the formatting of a table. This table is an example from the Publication Manual of the American Psychological Association (APA, 2001, p. 149). The fictitious general note has been included as an example. Table 1 Error Rates of Older and Younger Groups Level of difficulty Mean error rate Younger Older Standard deviation Younger Older Sample size Younger Older Low .05 .14 .08 .15 12 18 Moderate .05 .17 .07 .15 15 12 High .11 .26 .10 .21 16 14 Note. From “Generations,” by L.G. Elias and C.C. Bent, 2002, Journal of Geriatric Care, 5, p. 22. Placement of Tables and Figures: According to the APA (2002), the “typesetter lays out tables and figures closest to where they are first mentioned” (p. 155). However, check with your teacher concerning requirements about table and figure placement. Tables and figures are sometimes placed in text close to where they are mentioned and sometimes placed at the end of the paper. Figures: A figure is any type of illustration other than a table (chart, graph, photograph, or drawing). Use figures to complement information in text or to simplify text. Number figures in the order they are first mentioned in text. Do not write “the figure above” or “the figure below.” Figures should be large enough to read easily (between 8 point and 14 point font with sans serif typeface) and convey only essential information. The preferred typeface in figures is 12-pt Courier. Ensure that figures are simple, clear and consistent in presentation and vocabulary. Ensure data are plotted accurately and the grid scale is proportioned. Place labels close to the identified item. Axis labels on graphs should be parallel to their axes. Captions include the figure title and a brief, but descriptive, explanation of the figure. Double-space the caption and place it below the figure. The figure legend should be positioned within the borders of the figure. Startle Amplitude (mV) Example The following figure and note are each adapted from the Publication Manual of the American Psychological Association (APA, 2001, pp. 182-183). 5 4 3 2 1 0 Prelesion Acoustic Light and Acoustic Sham Lesion Postlesion Group Figure 1. Mean amplitude startle response for prelesion, sham lesion, and postlesion groups in acoustic and light-and-acoustic test conditions. References American Psychological Association. (2001). Publication manual of the American Psychological Association (5th ed.). Washington: Author. This handout was developed by the Writing Service at Conestoga College (2007). Any reproduction should acknowledge the source.

