The State of Girls and Women in STEM
advertisement

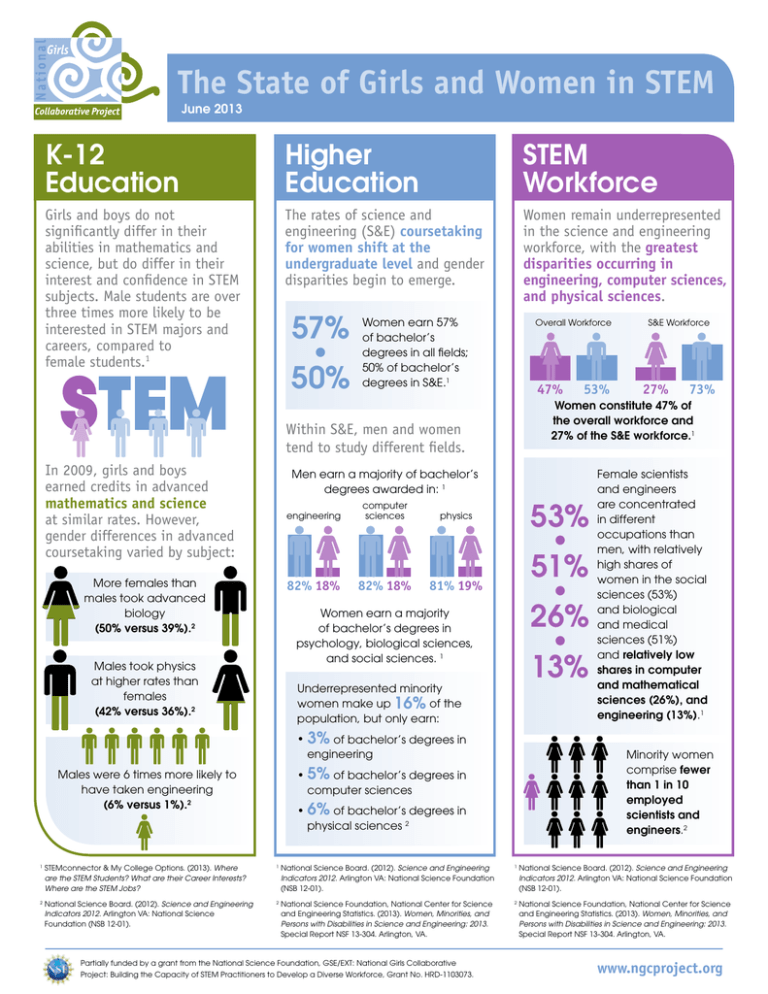
The State of Girls and Women in STEM June 2013 K-12 Education Higher Education STEM Workforce Girls and boys do not significantly differ in their abilities in mathematics and science, but do differ in their interest and confidence in STEM subjects. Male students are over three times more likely to be interested in STEM majors and careers, compared to female students.1 The rates of science and engineering (S&E) coursetaking for women shift at the undergraduate level and gender disparities begin to emerge. Women remain underrepresented in the science and engineering workforce, with the greatest disparities occurring in engineering, computer sciences, and physical sciences. 57% • 50% STEM Women earn 57% of bachelor’s degrees in all fields; 50% of bachelor’s degrees in S&E.1 Overall Workforce 47% Men earn a majority of bachelor’s degrees awarded in: 1 More females than males took advanced biology (50% versus 39%).2 engineering computer sciences physics 82% 18% 82% 18% 81% 19% 53% • 51% • 26% • 13% Women earn a majority of bachelor’s degrees in psychology, biological sciences, and social sciences. 1 Males took physics at higher rates than females (42% versus 36%).2 Underrepresented minority women make up 16% of the population, but only earn: • 3% of bachelor’s degrees in engineering 73% Female scientists and engineers are concentrated in different occupations than men, with relatively high shares of women in the social sciences (53%) and biological and medical sciences (51%) and relatively low shares in computer and mathematical sciences (26%), and engineering (13%).1 Minority women comprise fewer than 1 in 10 employed scientists and engineers.2 •5 % of bachelor’s degrees in computer sciences Males were 6 times more likely to have taken engineering (6% versus 1%).2 27% Women constitute 47% of the overall workforce and 27% of the S&E workforce.1 Within S&E, men and women tend to study different fields. In 2009, girls and boys earned credits in advanced mathematics and science at similar rates. However, gender differences in advanced coursetaking varied by subject: 53% S&E Workforce •6 % of bachelor’s degrees in physical sciences 2 1 S TEMconnector & My College Options. (2013). Where are the STEM Students? What are their Career Interests? Where are the STEM Jobs? 1 ational Science Board. (2012). Science and Engineering N Indicators 2012. Arlington VA: National Science Foundation (NSB 12-01). 1 ational Science Board. (2012). Science and Engineering N Indicators 2012. Arlington VA: National Science Foundation (NSB 12-01). 2 ational Science Board. (2012). Science and Engineering N Indicators 2012. Arlington VA: National Science Foundation (NSB 12-01). 2 ational Science Foundation, National Center for Science N and Engineering Statistics. (2013). Women, Minorities, and Persons with Disabilities in Science and Engineering: 2013. Special Report NSF 13-304. Arlington, VA. 2 ational Science Foundation, National Center for Science N and Engineering Statistics. (2013). Women, Minorities, and Persons with Disabilities in Science and Engineering: 2013. Special Report NSF 13-304. Arlington, VA. Partially funded by a grant from the National Science Foundation, GSE/EXT: National Girls Collaborative Project: Building the Capacity of STEM Practitioners to Develop a Diverse Workforce, Grant No. HRD-1103073. www.ngcproject.org

