The Effects of Temperature, Pressure, and Humidity Variations on
advertisement
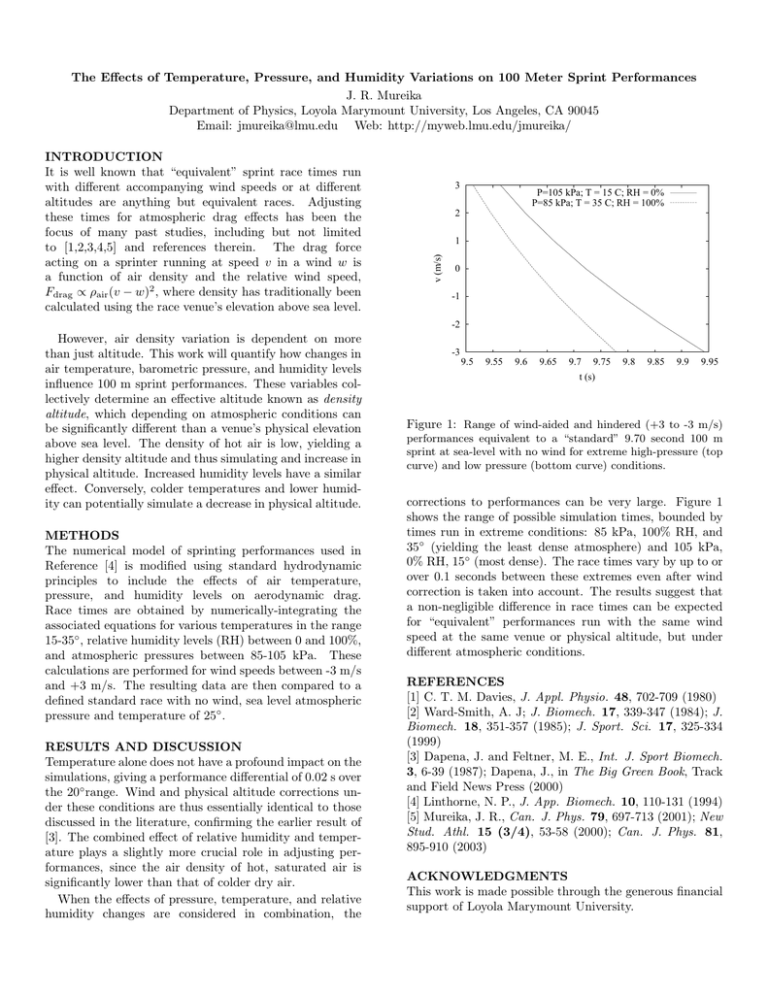
The Effects of Temperature, Pressure, and Humidity Variations on 100 Meter Sprint Performances J. R. Mureika Department of Physics, Loyola Marymount University, Los Angeles, CA 90045 Email: jmureika@lmu.edu Web: http://myweb.lmu.edu/jmureika/ 3 P=105 kPa; T = 15 C; RH = 0% P=85 kPa; T = 35 C; RH = 100% 2 1 v (m/s) INTRODUCTION It is well known that “equivalent” sprint race times run with different accompanying wind speeds or at different altitudes are anything but equivalent races. Adjusting these times for atmospheric drag effects has been the focus of many past studies, including but not limited to [1,2,3,4,5] and references therein. The drag force acting on a sprinter running at speed v in a wind w is a function of air density and the relative wind speed, Fdrag ∝ ρair (v − w)2 , where density has traditionally been calculated using the race venue’s elevation above sea level. 0 -1 -2 However, air density variation is dependent on more than just altitude. This work will quantify how changes in air temperature, barometric pressure, and humidity levels influence 100 m sprint performances. These variables collectively determine an effective altitude known as density altitude, which depending on atmospheric conditions can be significantly different than a venue’s physical elevation above sea level. The density of hot air is low, yielding a higher density altitude and thus simulating and increase in physical altitude. Increased humidity levels have a similar effect. Conversely, colder temperatures and lower humidity can potentially simulate a decrease in physical altitude. METHODS The numerical model of sprinting performances used in Reference [4] is modified using standard hydrodynamic principles to include the effects of air temperature, pressure, and humidity levels on aerodynamic drag. Race times are obtained by numerically-integrating the associated equations for various temperatures in the range 15-35◦ , relative humidity levels (RH) between 0 and 100%, and atmospheric pressures between 85-105 kPa. These calculations are performed for wind speeds between -3 m/s and +3 m/s. The resulting data are then compared to a defined standard race with no wind, sea level atmospheric pressure and temperature of 25◦ . RESULTS AND DISCUSSION Temperature alone does not have a profound impact on the simulations, giving a performance differential of 0.02 s over the 20◦ range. Wind and physical altitude corrections under these conditions are thus essentially identical to those discussed in the literature, confirming the earlier result of [3]. The combined effect of relative humidity and temperature plays a slightly more crucial role in adjusting performances, since the air density of hot, saturated air is significantly lower than that of colder dry air. When the effects of pressure, temperature, and relative humidity changes are considered in combination, the -3 9.5 9.55 9.6 9.65 9.7 9.75 t (s) 9.8 9.85 9.9 9.95 Figure 1: Range of wind-aided and hindered (+3 to -3 m/s) performances equivalent to a “standard” 9.70 second 100 m sprint at sea-level with no wind for extreme high-pressure (top curve) and low pressure (bottom curve) conditions. corrections to performances can be very large. Figure 1 shows the range of possible simulation times, bounded by times run in extreme conditions: 85 kPa, 100% RH, and 35◦ (yielding the least dense atmosphere) and 105 kPa, 0% RH, 15◦ (most dense). The race times vary by up to or over 0.1 seconds between these extremes even after wind correction is taken into account. The results suggest that a non-negligible difference in race times can be expected for “equivalent” performances run with the same wind speed at the same venue or physical altitude, but under different atmospheric conditions. REFERENCES [1] C. T. M. Davies, J. Appl. Physio. 48, 702-709 (1980) [2] Ward-Smith, A. J,̇ J. Biomech. 17, 339-347 (1984); J. Biomech. 18, 351-357 (1985); J. Sport. Sci. 17, 325-334 (1999) [3] Dapena, J. and Feltner, M. E., Int. J. Sport Biomech. 3, 6-39 (1987); Dapena, J., in The Big Green Book, Track and Field News Press (2000) [4] Linthorne, N. P., J. App. Biomech. 10, 110-131 (1994) [5] Mureika, J. R., Can. J. Phys. 79, 697-713 (2001); New Stud. Athl. 15 (3/4), 53-58 (2000); Can. J. Phys. 81, 895-910 (2003) ACKNOWLEDGMENTS This work is made possible through the generous financial support of Loyola Marymount University.
