Accuracy and Precision in Measurements
advertisement

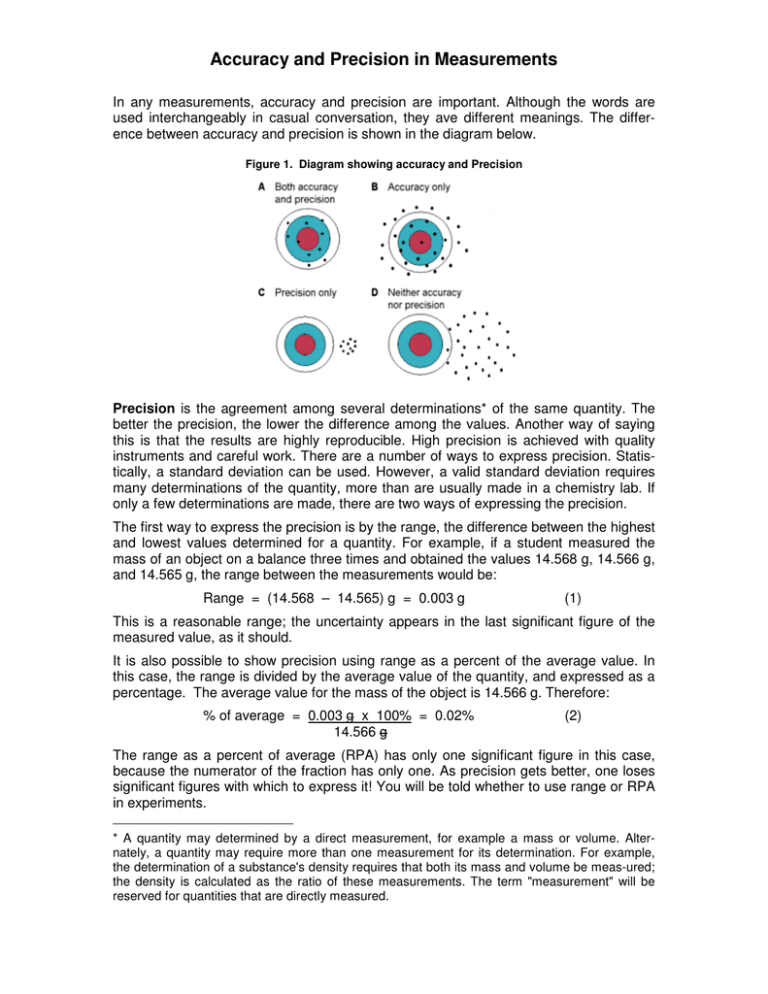
Accuracy and Precision in Measurements In any measurements, accuracy and precision are important. Although the words are used interchangeably in casual conversation, they ave different meanings. The difference between accuracy and precision is shown in the diagram below. Figure 1. Diagram showing accuracy and Precision Precision is the agreement among several determinations* of the same quantity. The better the precision, the lower the difference among the values. Another way of saying this is that the results are highly reproducible. High precision is achieved with quality instruments and careful work. There are a number of ways to express precision. Statistically, a standard deviation can be used. However, a valid standard deviation requires many determinations of the quantity, more than are usually made in a chemistry lab. If only a few determinations are made, there are two ways of expressing the precision. The first way to express the precision is by the range, the difference between the highest and lowest values determined for a quantity. For example, if a student measured the mass of an object on a balance three times and obtained the values 14.568 g, 14.566 g, and 14.565 g, the range between the measurements would be: Range = (14.568 – 14.565) g = 0.003 g (1) This is a reasonable range; the uncertainty appears in the last significant figure of the measured value, as it should. It is also possible to show precision using range as a percent of the average value. In this case, the range is divided by the average value of the quantity, and expressed as a percentage. The average value for the mass of the object is 14.566 g. Therefore: % of average = 0.003 g x 100% = 0.02% 14.566 g (2) The range as a percent of average (RPA) has only one significant figure in this case, because the numerator of the fraction has only one. As precision gets better, one loses significant figures with which to express it! You will be told whether to use range or RPA in experiments. * A quantity may determined by a direct measurement, for example a mass or volume. Alternately, a quantity may require more than one measurement for its determination. For example, the determination of a substance's density requires that both its mass and volume be meas-ured; the density is calculated as the ratio of these measurements. The term "measurement" will be reserved for quantities that are directly measured. Accuracy and Precision in Measurements Accuracy is the agreement between an experimental value, or the average of several determinations of the value, with an accepted or theoretical (“true”) value for a quantity. Accuracy is usually expressed as a percent difference: % difference = (experimental – true) x 100% true (3) The accepted value for the density of gold metal is 19.31 g/cm3. If a student measured the mass and volume of a sample of gold, and obtained a value of 19.03 g/cm3, the percent difference would be calculated as % difference = (19.03 – 19.31) g x 100% = – 1.5% 19.31 g (4) A percent difference can be positive or negative; the sign shows whether the experimenttal value is higher or lower than the actual or theoretical value. This distinction is not used in precision, since all values are experimental. If one has high precision, or reproducibility, and poor accuracy, there is usually a systematic error of some sort. This can involve improper calibration or mishandling of a measuring device (very consistent mishandling, but mishandling just the same!). Good accuracy and poor precision can result from a combination of sloppy experimental procedure and dumb luck. However, some quantities are difficult to determine with high precision, such as those involving lab animals. In such cases, the experimenter must make many determinations of the value and average them. The goal of any experimenter should be to achieve both high precision and high accuracy in his or her work. Your lab work will often be graded on the basis of your precision, accuracy, or both. Pay attention to technique in the lab and your work will be of high quality.


