Linear Regression using Excel
advertisement

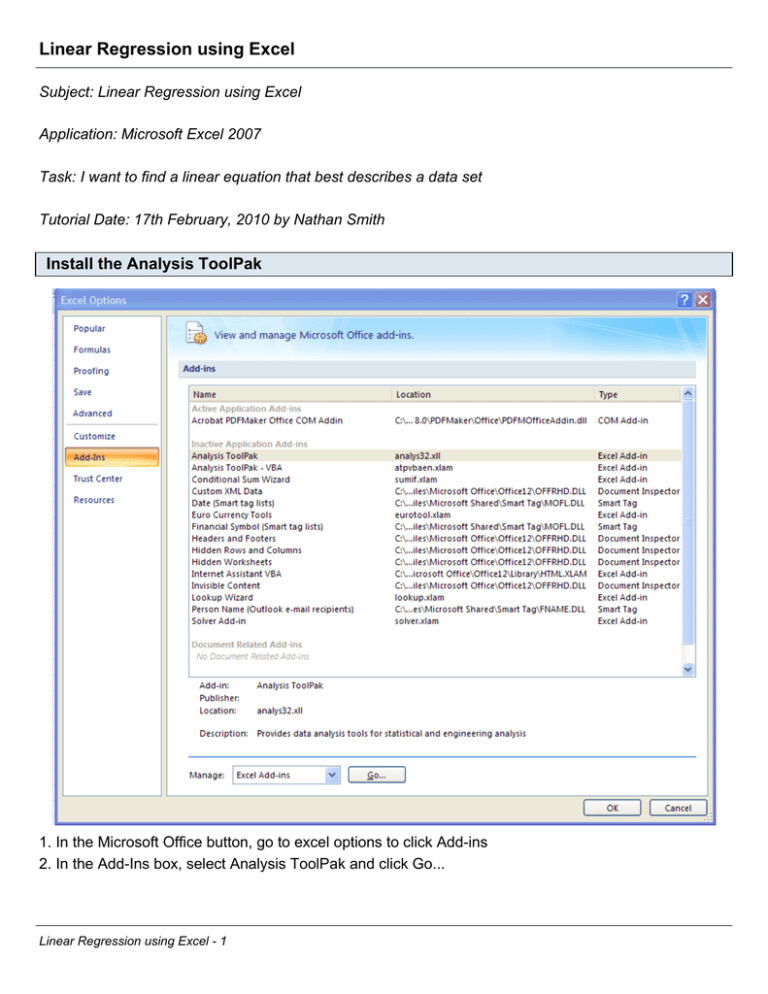
Linear Regression using Excel Subject: Linear Regression using Excel Application: Microsoft Excel 2007 Task: I want to find a linear equation that best describes a data set Tutorial Date: 17th February, 2010 by Nathan Smith Install the Analysis ToolPak 1. In the Microsoft Office button, go to excel options to click Add-ins 2. In the Add-Ins box, select Analysis ToolPak and click Go... Linear Regression using Excel - 1 Install the Analysis ToolPak (continue) 3. In the Add-Ins available box, check the Analysis ToolPak and then OK 4. If Analysis ToolPak is not listed in the Add-Ins available box, click Browse to locate it. Linear Regression using Excel - 2 Linear Regression using the Data Analysis Add-In Suppose we want to determine a whether Y is a function of X (Y)i = a + b(X)i + (error)i where: (Y)i = value of Y for observation i a = mean value of Y when X is zero (inercept coefficient) b = average change in Y given a one unit change in X, i,e (slope of X) (X)i = value of X for observation i 1. In the data analysis tool select the regression and then click Ok. . Linear Regression using Excel - 3 Select the Input Data Set for Y and X values 2. After clicking the regression, a regression box appears. 3. Select the Inputs for Y range and X range. 4. Select the place where you want your output 5. Check the Labels and then click Ok Linear Regression using Excel - 4 Output The output is given in the coefficients column in the last set of output 1. a = 1.329 (Intercept Coefficient) 2. b = 0.801 (Coefficient of X i.e. slope) So our regression equation is Y = 1.329 + 0.801(X) Also in the regression statistics output gives the goodness of fit measure 3. Adjusted R square = 0.3984 which measures the fit This means 39.84% of Y is determined by X Linear Regression using Excel - 5


