Presentation Outline Management history
advertisement

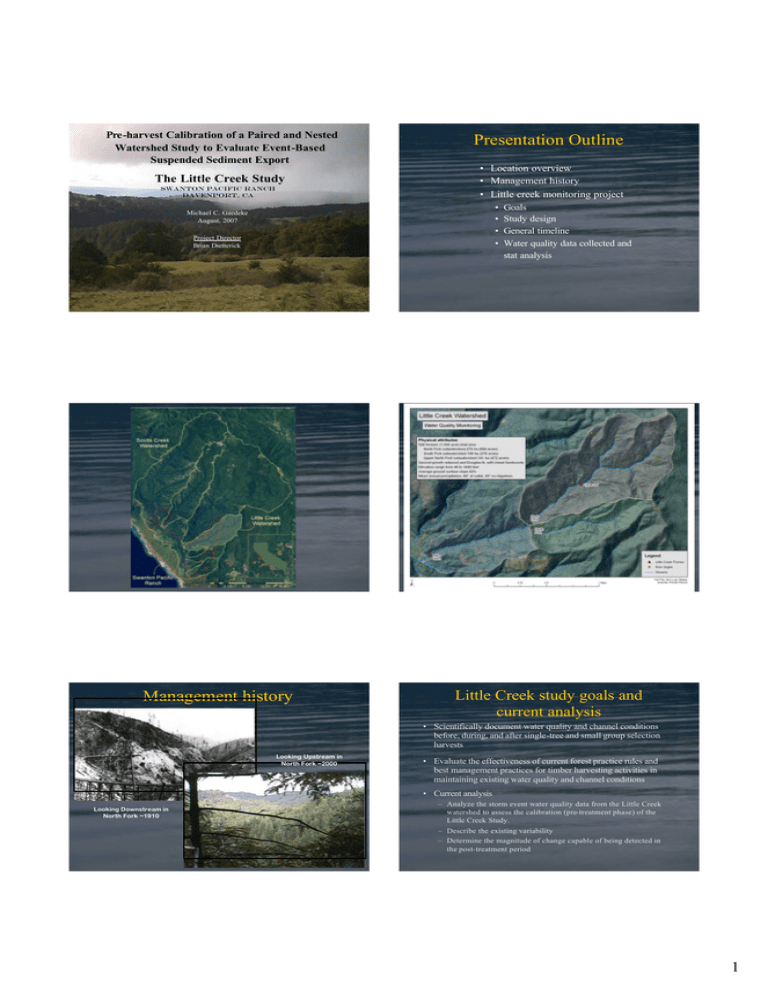
Pre-harvest Calibration of a Paired and Nested Watershed Study to Evaluate Event-Based Suspended Sediment Export The Little Creek Study Swanton Pacific Ranch Davenport, CA Presentation Outline • Location overview • Management history • Little creek monitoring project • • • • Michael C. Gaedeke August, 2007 Project Director Brian Dietterick Management history Goals Study design General timeline Water quality data collected and stat analysis Little Creek study goals and current analysis • Scientifically document water quality and channel conditions before, during, and after single-tree and small group selection harvests Looking Upstream in North Fork ~2000 • Evaluate the effectiveness of current forest practice rules and best management practices for timber harvesting activities in maintaining existing water quality and channel conditions • Current analysis Looking Downstream in North Fork ~1910 – Analyze the storm event water quality data from the Little Creek watershed to assess the calibration (pre-treatment phase) of the Little Creek Study. – Describe the existing variability – Determine the magnitude of change capable of being detected in the post-treatment period 1 Timeline and study design Calibration period 2001-2008 •Measure existing water quality Treatment in 2008 •Harvest portion of watershed between the North Fork and Upper North Fork stations Post-treatment 2008-2011+ •Measure for potential change in water quality Paired Watershed Design •Control watershed: South Fork •Treatment watershed: North Fork Nested Watershed Design •Control Watershed: Upper North Fork •Treatment watershed: North Fork Field data collection – stage and streamflow Field data collection – water quality samples Stage A Fitted Line Plot S F Flow = 16.7 2 - 51.81 SF Stage + 40.2 0 SF St ag e* *2 12 S R- Sq SF Fl ow (f t^ 3/s) B • 1-hour interval samples • Collection of 24 bottles before swap 0.133903 99.9% R- Sq(a dj) 10 99.9% 8 6 4 2 0 0. 7 0.8 0.9 1.0 S F St ag e (ft ) 1.1 1.2 C Fitted Line Plot NF Flow = - 1 .476 - 1.2 21 N F Stage + 29.10 NF S tage**2 25 S R-Sq R-Sq(a dj) D NF Flo w (ft ^3/ s) 20 A. Flow Meter B. Pressure 0.5 7 35 4 7 99 .6 % 99 .5 % 15 10 5 Transducer C. FW -1 Stage 0 Recorder 0.2 0.3 0.4 D. Staff Gage 0. 5 0.6 0.7 NF St ag e (ft ) Lab Water Quality Testing • Lab analysis of 1 hour samples 0.8 0.9 1.0 Defining the dataset – Predicting SSC from turbidity • Need for SSC to be predicted from turbidity • Turbidity – Turbidity shown to be a better predictor than flow • Units: nephlometric turbidity units (NTUs) • Previous research has indicated SSC versus turbidity is a variable relationship that is best defined on an event basis • Regression analysis used to establish relationship. • Suspended Sediment Concentration (SSC) • Units: mg/L A A. Turbidimeter B. Scale B – Regressions assessed based on r 2, p-value, residual plots, and fits – Data transformations when necessary 2 Defining the dataset – storm events • Minimum storm event size based on turbidity – Peak must be greater than 20 NTUs – Only samples >20 NTUs analyzed for SSC • Define storm events based on the hydrograph using Hewlett and Hibbard (1967) 0.05 slope method End event – Separates storm flow from base flow • Storm event ends when turbidity drops below 20 NTUs or the 0.05 slope line intersects the hydrograph Paired and nested analysis after transformations Event load calculation Paired • Events with complete SSC and flow datasets used for analysis • Calculate individual hourly loads to determine event loads North Fork load (l n[kg/ha]) – Must have both datasets to calculate loads Fitted Line Plot Nort h Fork lo ad (ln[kg /ha]) = 2. 02 3 + 0. 76 57 Sout h Fork lo ad (ln[kg /ha]) 7 Regression 95% CI 6 S R -Sq 5 1. 00230 64.8% R -Sq( adj) 4 63.4% Nested 3 2 Fitt ed Line Plo t 1 No rth Fo rk l oad (ln[kg/ha]) = 0 .5 0 90 + 0 .8 39 6 Uppe r N. Fo rk lo ad (ln[k g/ha]) 0 -3 -2 -1 0 1 2 South Fork load (l n[kg/ha]) 3 • Event loads establish the calibration dataset – Changes in the relationship used to detect change 4 North Fork l oad (ln[kg/ha]) – High temporal variability requires hourly sums 6 Regression 95% C I 55 S 4 95.5% 95.3% 3 2 1 0 -1 -2 -1 0 1 2 3 Upper N. Fork l oad (ln[kg/ha]) 4 5 6 New regression line comparison to existing confidence intervals for NF versus SF Assessing detectable magnitude of change using confidence intervals 90% 30% Increase 50% 70% Increase in in Existing Exist ingNF NF Conditions, Conditions,NF NFvv SF SF 77 Data Data Points Points and and Data Points and Data Points and Associated Associated Regressions Regr essions Associated Regressions Associated Regressions Existing conditions Existing Existing conditions conditions Existing conditions NF load increased 50% NFNF load load increased incr eased 70% 90% NF load increased 30% 66 North Fork Fork load load (ln[kg/ha]) North (ln[kg/ha]) • Back-transformation of confidence interval into non-logarithmic numbers not valid • Generate a synthetic dataset representing percentage increases over the original dataset • Transform the new dataset, perform regression, and compare new regression line to original confidence interval 0.382495 R -Sq R -Sq( adj) ------------95% C.I. for existing conditions 55 ------------95% 95% C.I. C.I. existing existing conditions conditions 95% C.I. forforfor existing conditions 44 33 22 1 1 0 0 -1 -3 -3 -2 -2 -2 -1 -1 -1 000 111 222 333 SouthFork Forkload load (ln[kg/ha]) South South Fork lo ad(ln[kg/ha]) (ln[kg/ha]) 444 555 3 New regression line comparison to existing confidence intervals for NF versus UNF 30% 10% Increase in Existing NF Conditions, NF v UNF 6 NorthFork Fork load load(ln[kg/ha]) (ln[kg/ha]) North 6 Data Points and Data Points and Associated Regr essions Associated Regressions Existing conditions Existing conditions NF load increased 30% NF load increased 10% ------existing conditions ------- 95%95% C.I.C.I. for for existing conditions 5 5 4 4 Conclusions • Suspended sediment versus turbidity relationship has allowed for prediction of suspended sediment data – Established on an event basis • Data thus far has yielded a sufficient number of event-specific suspended sediment loads to enable simple linear regression analysis 33 22 11 00 -2 -2 -1 -1 0 1 2 3 4 0 1 3 4 Upper North Fork2load (ln[kg/ha]) Upper North Fork load (ln[kg/ha]) 5 5 6 6 Other Little Creek Study Components – Nested (NF versus UNF) relationship indicates less variability than paired (NF versus SF) relationship – Narrower confidence intervals for magnitude of change detection for nested relationship Questions? • Annual geomorphic surveys – Longitudinal profiles and cross sections to detect potential sediment source/sink areas • LIDAR mapping analysis (Russ White) – Stream channel and road features under forest canopy – Comparison with conventional surveys 4
