1 Homework Assignment 1 - 10 Points Due at beginning of class
advertisement

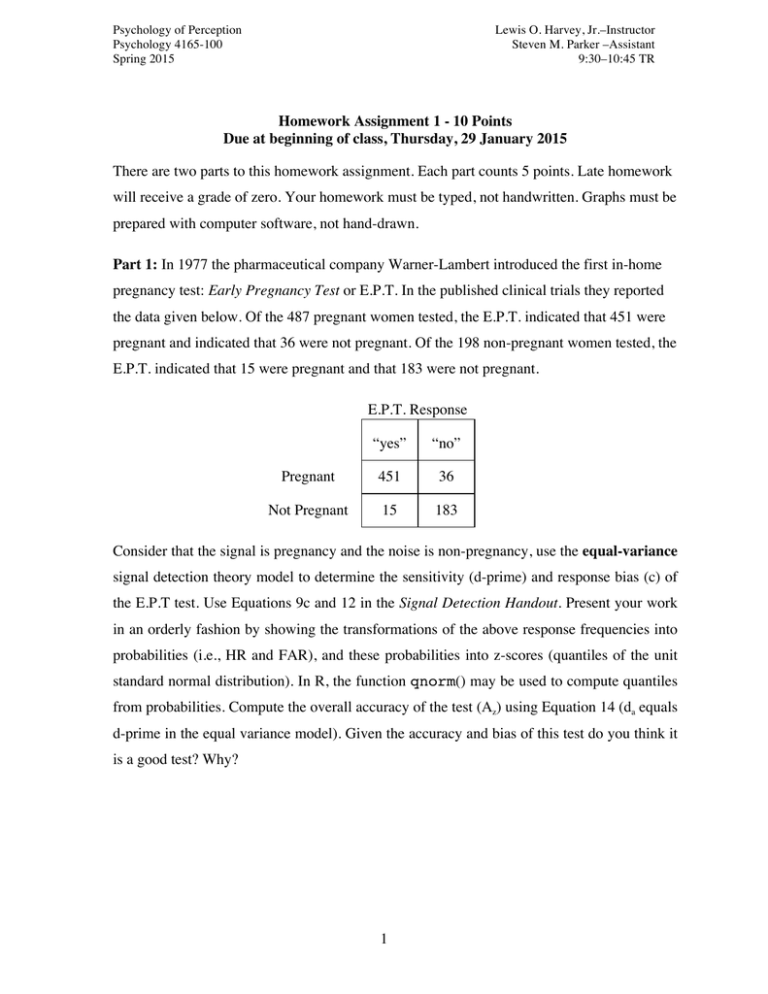
Psychology of Perception Psychology 4165-100 Spring 2015 Lewis O. Harvey, Jr.–Instructor Steven M. Parker –Assistant 9:30–10:45 TR Homework Assignment 1 - 10 Points Due at beginning of class, Thursday, 29 January 2015 There are two parts to this homework assignment. Each part counts 5 points. Late homework will receive a grade of zero. Your homework must be typed, not handwritten. Graphs must be prepared with computer software, not hand-drawn. Part 1: In 1977 the pharmaceutical company Warner-Lambert introduced the first in-home pregnancy test: Early Pregnancy Test or E.P.T. In the published clinical trials they reported the data given below. Of the 487 pregnant women tested, the E.P.T. indicated that 451 were pregnant and indicated that 36 were not pregnant. Of the 198 non-pregnant women tested, the E.P.T. indicated that 15 were pregnant and that 183 were not pregnant. E.P.T. Response “yes” “no” Pregnant 451 36 Not Pregnant 15 183 Consider that the signal is pregnancy and the noise is non-pregnancy, use the equal-variance signal detection theory model to determine the sensitivity (d-prime) and response bias (c) of the E.P.T test. Use Equations 9c and 12 in the Signal Detection Handout. Present your work in an orderly fashion by showing the transformations of the above response frequencies into probabilities (i.e., HR and FAR), and these probabilities into z-scores (quantiles of the unit standard normal distribution). In R, the function qnorm() may be used to compute quantiles from probabilities. Compute the overall accuracy of the test (Az) using Equation 14 (da equals d-prime in the equal variance model). Given the accuracy and bias of this test do you think it is a good test? Why? 1 Psychology of Perception Psychology 4165-100 Spring 2015 Lewis O. Harvey, Jr.–Instructor Steven M. Parker –Assistant 9:30–10:45 TR Part 2: An imaging company is developing improved methods for detecting cancer in x-rays. They tested radiologists on their ability to detect cancer using three different ways of enhancing cancer cells present in the x-rays. In the table below are given the number of times out of 100 trials that the radiologists indicated that cancer was present under four different imaging techniques. The radiologists made their judgments using five different decision criteria ranging from very liberal (Xc-1) to very conservative (Xc-5). S0 à no cancer present in x-ray S1 à cancer present; image enhancement method 1 S2 à cancer present; image enhancement method 2 S3 à cancer present; image enhancement method 3 S0 Xc-1 84 Xc-2 62 Xc-3 34 Xc-4 21 Xc-5 5 S1 93 79 54 38 14 S2 98 90 73 58 27 S3 99 96 86 76 46 Plot two ROC graphs from these data: one graph in linear probability coordinates (ranging between 0.0 and 1.0), the other in z-score coordinates (ranging from -2.5 to +2.5). Hint: the R function qnorm() converts probabilities to quantiles (z-scores). Make the x- and y-axes of your graph equal in length so that each graph forms a square. Take care to properly label your graphs and to make them neat. What is your opinion about how well the Gaussian signal detection model describes these data? In four sentences or less explain your answer. Using the equal-variance signal detection model, compute the sensitivity of each technique (S1, S2, and S3) in detecting cancer (use S0 as the blank trials). Which technique is the best? Why? 2


