Common Core Standards – Science and Technology Middle School
advertisement
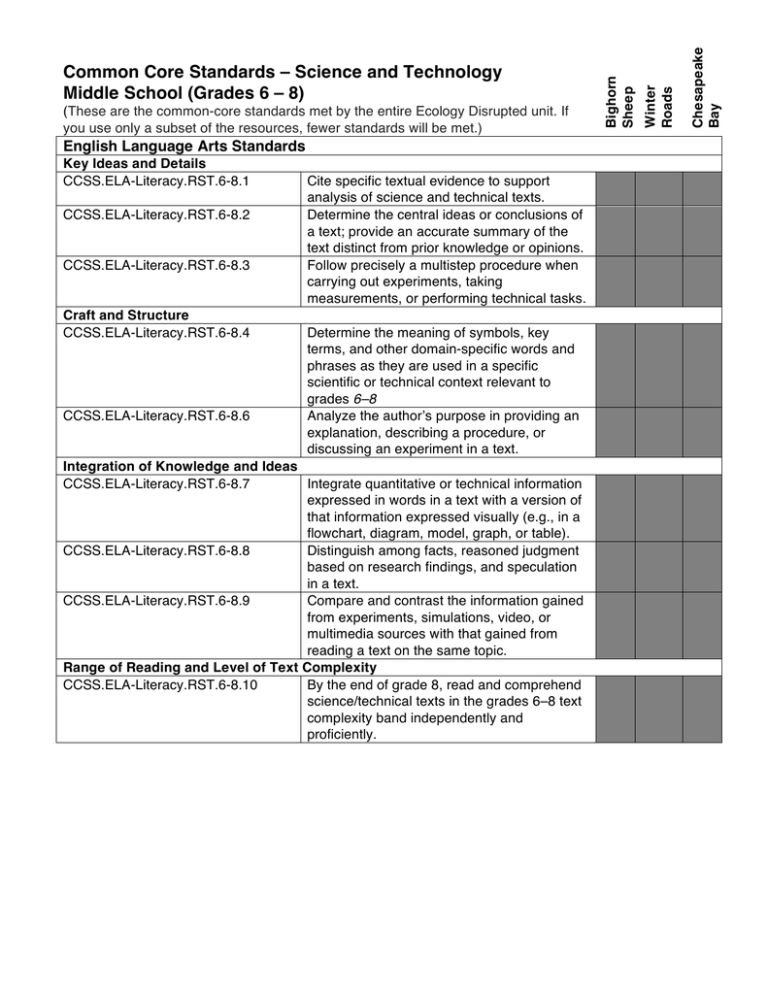
English Language Arts Standards Key Ideas and Details CCSS.ELA-Literacy.RST.6-8.1 CCSS.ELA-Literacy.RST.6-8.2 CCSS.ELA-Literacy.RST.6-8.3 Craft and Structure CCSS.ELA-Literacy.RST.6-8.4 CCSS.ELA-Literacy.RST.6-8.6 Cite specific textual evidence to support analysis of science and technical texts. Determine the central ideas or conclusions of a text; provide an accurate summary of the text distinct from prior knowledge or opinions. Follow precisely a multistep procedure when carrying out experiments, taking measurements, or performing technical tasks. Determine the meaning of symbols, key terms, and other domain-specific words and phrases as they are used in a specific scientific or technical context relevant to grades 6–8 Analyze the author’s purpose in providing an explanation, describing a procedure, or discussing an experiment in a text. Integration of Knowledge and Ideas CCSS.ELA-Literacy.RST.6-8.7 Integrate quantitative or technical information expressed in words in a text with a version of that information expressed visually (e.g., in a flowchart, diagram, model, graph, or table). CCSS.ELA-Literacy.RST.6-8.8 • Distinguish among facts, reasoned judgment based on research findings, and speculation in a text. CCSS.ELA-Literacy.RST.6-8.9 • Compare and contrast the information gained from experiments, simulations, video, or multimedia sources with that gained from reading a text on the same topic. Range of Reading and Level of Text Complexity CCSS.ELA-Literacy.RST.6-8.10 • By the end of grade 8, read and comprehend science/technical texts in the grades 6–8 text complexity band independently and proficiently. Chesapeake Bay Winter Roads (These are the common-core standards met by the entire Ecology Disrupted unit. If you use only a subset of the resources, fewer standards will be met.) Bighorn Sheep Common Core Standards – Science and Technology Middle School (Grades 6 – 8) CCSS.Math.Content.6.RP.A.3 CCSS.Math.Content.7.RP.A.2a Use ratio and rate reasoning to solve realworld and mathematical problems, e.g., by reasoning about tables of equivalent ratios, tape diagrams, double number line diagrams, or equations. • Decide whether two quantities are in a proportional relationship, e.g., by testing for equivalent ratios in a table or graphing on a coordinate plane and observing whether the graph is a straight line through the origin. Construct and interpret scatter plots for bivariate measurement data to investigate patterns of association between two quantities. Describe patterns such as clustering, outliers, positive or negative association, linear association, and nonlinear association. • Understand that patterns of association can also be seen in bivariate categorical data by displaying frequencies and relative frequencies in a two-way table. Construct and interpret a two-way table summarizing data on two categorical variables collected from the same subjects. Use relative frequencies calculated for rows or columns to describe possible association between the two variables. For example, collect data from students in your class on whether or not they have a curfew on school nights and whether or not they have assigned chores at home. Is there evidence that those who have a curfew also tend to have chores? CCSS.Math.Content.8.SP.A.1 CCSS.Math.Content.8.SP.A.4 Chesapeake Bay Winter Roads Bighorn Sheep Mathematics Standards
