DIII Facts and Figures
advertisement

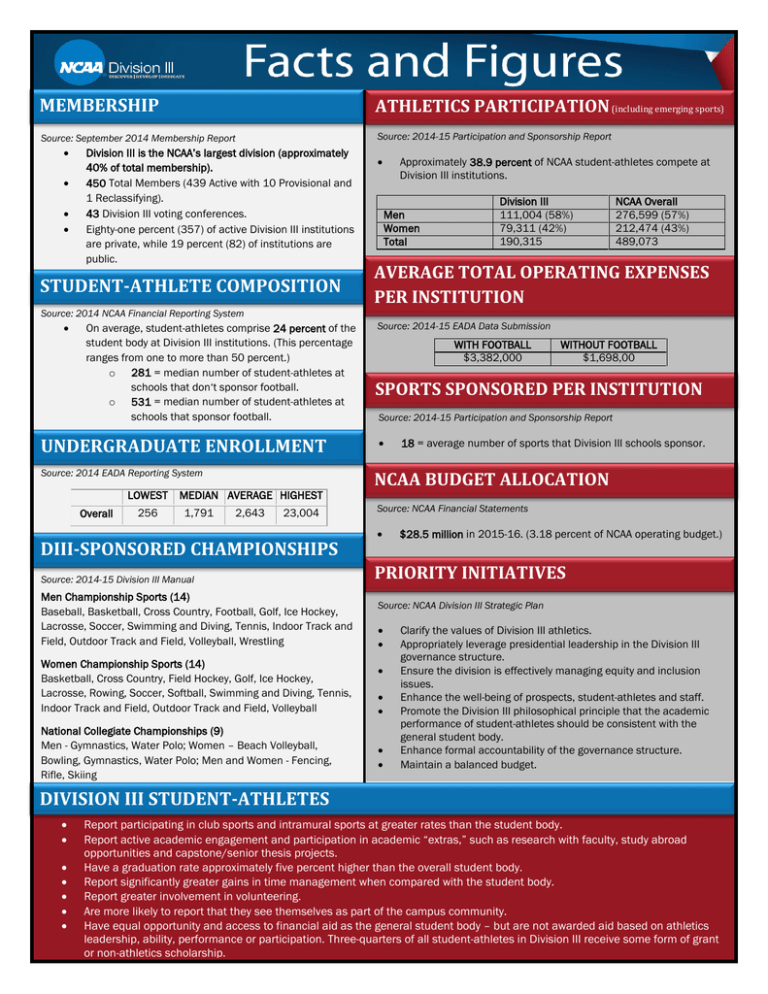
MEMBERSHIP ATHLETICS PARTICIPATION (including emerging sports) Source: 2014-15 Participation and Sponsorship Report Source: September 2014 Membership Report • • • • Division III is the NCAA’s largest division (approximately 40% of total membership). 450 Total Members (439 Active with 10 Provisional and 1 Reclassifying). 43 Division III voting conferences. Eighty-one percent (357) of active Division III institutions are private, while 19 percent (82) of institutions are public. STUDENT-ATHLETE COMPOSITION Source: 2014 NCAA Financial Reporting System • On average, student-athletes comprise 24 percent of the student body at Division III institutions. (This percentage ranges from one to more than 50 percent.) o 281 = median number of student-athletes at schools that don‘t sponsor football. o 531 = median number of student-athletes at schools that sponsor football. UNDERGRADUATE ENROLLMENT Source: 2014 EADA Reporting System LOWEST Overall 256 MEDIAN AVERAGE HIGHEST 1,791 2,643 23,004 DIII-SPONSORED CHAMPIONSHIPS Source: 2014-15 Division III Manual Men Championship Sports (14) Baseball, Basketball, Cross Country, Football, Golf, Ice Hockey, Lacrosse, Soccer, Swimming and Diving, Tennis, Indoor Track and Field, Outdoor Track and Field, Volleyball, Wrestling Women Championship Sports (14) Basketball, Cross Country, Field Hockey, Golf, Ice Hockey, Lacrosse, Rowing, Soccer, Softball, Swimming and Diving, Tennis, Indoor Track and Field, Outdoor Track and Field, Volleyball National Collegiate Championships (9) Men - Gymnastics, Water Polo; Women – Beach Volleyball, Bowling, Gymnastics, Water Polo; Men and Women - Fencing, Rifle, Skiing • Approximately 38.9 percent of NCAA student-athletes compete at Division III institutions. Men Women Total Division III 111,004 (58%) 79,311 (42%) 190,315 NCAA Overall 276,599 (57%) 212,474 (43%) 489,073 AVERAGE TOTAL OPERATING EXPENSES PER INSTITUTION Source: 2014-15 EADA Data Submission WITH FOOTBALL $3,382,000 WITHOUT FOOTBALL $1,698,00 SPORTS SPONSORED PER INSTITUTION Source: 2014-15 Participation and Sponsorship Report • 18 = average number of sports that Division III schools sponsor. NCAA BUDGET ALLOCATION Source: NCAA Financial Statements • $28.5 million in 2015-16. (3.18 percent of NCAA operating budget.) PRIORITY INITIATIVES Source: NCAA Division III Strategic Plan • • • • • • • Clarify the values of Division III athletics. Appropriately leverage presidential leadership in the Division III governance structure. Ensure the division is effectively managing equity and inclusion issues. Enhance the well-being of prospects, student-athletes and staff. Promote the Division III philosophical principle that the academic performance of student-athletes should be consistent with the general student body. Enhance formal accountability of the governance structure. Maintain a balanced budget. DIVISION III STUDENT-ATHLETES • • • • • • • Report participating in club sports and intramural sports at greater rates than the student body. Report active academic engagement and participation in academic “extras,” such as research with faculty, study abroad opportunities and capstone/senior thesis projects. Have a graduation rate approximately five percent higher than the overall student body. Report significantly greater gains in time management when compared with the student body. Report greater involvement in volunteering. Are more likely to report that they see themselves as part of the campus community. Have equal opportunity and access to financial aid as the general student body – but are not awarded aid based on athletics leadership, ability, performance or participation. Three-quarters of all student-athletes in Division III receive some form of grant or non-athletics scholarship. POSITIONING STATEMENT Source: 2014-15 Participation and Sponsorship Report FOLLOW YOUR PASSIONS AND DISCOVER YOUR POTENTIAL. The college experience is a time of learning and growth•— aApproximately chance to follow passions andstudent-athletes develop potential. For 38.9 percent of NCAA compete at Division III institutions. student-athletes in Division III, all of this happens most importantly in the classroom and through earning an Division III Overall academic degree. The Division III experience provides for passionate participation in a competitive Men 111,004 (58%) 276,599athletic (56%) 79,311 (42%) 212,474 (43%) with environment, in which student-athletes push themselvesWomen to excellence and build upon their academic success Total 190,315 489,073 new challenges and life skills. And student-athletes are encouraged to pursue their full passions and find their potential through a comprehensive educational experience. THE THREE D’S COMPOSITION STUDENT-ATHLETE DISCOVER Division III student-athletes are encouraged to pursue their interests and passions beyond the classroom and field of Source: 2014-15 EADA Data Submission play…to discover themselves. DEVELOP WITH FOOTBALL WITHOUT FOOTBALL $3,382,000 $1,698,000 Division III institutions provide an environment that encourages student-athletes to develop into well-rounded adults. Small SPONSORED PER INSTITUTION class sizes, the ability to participate in more than one sport,SPORTS and an emphasis on participating in activities outside of the classroom are all hallmarksSource: of the2014-15 Division III experience. Participation and Sponsorship Report UNDERGRADUATE ENROLLMENT • 18= average number of sports that Division III schools sponsor. DEDICATE Division III institutions expect student-athletes to dedicate themselves to achieving their potential. Student-athletes must manage their busy schedules, keep up with class work and face the same challenges as the rest of the student-body. Source: NCAA Financial Statements WHAT DOES DIVISION III ATHLETICS HAVE TO OFFER? • 3.18 percent of NCAA operating budget which equals approximately • Division III athletics provides a well-rounded collegiate experience involves a balance of rigorous academics, $29 millionthat in 2015-16. DIII-SPONSORED CHAMPIONSHIPS competitive athletics, and the opportunity to pursue the multitude of other co-curricular and extra-curricular opportunities offered on Division III campuses. • Division III playing season and eligibility standards minimize conflicts between athletics and academics, allowing Source: NCAA Division III Strategic Plan student-athletes to focus on their academic programs and the achievement of a degree. Clarify the values of Division III athletics. • Division III offers an intense and competitive athletics •environment for student-athletes who play for the love • Appropriately leverage presidential leadership in the Division III of the game, without the obligation of an athletics scholarship. governance structure. • Ensure theimpact divisionof is effectively equity and inclusion • Division III athletics departments place special importance on the athleticsmanaging on the participants rather issues. than on the spectators. The student-athlete’s experience isEnhance of paramount concern. • the well-being of prospects, student-athletes and staff. • Division III athletics departments are dedicated to offering broad-based programs with a high number wide • Promote the Division III philosophical principle that theand academic of student-athletes should be consistent with the range of athletics participation opportunities for both menperformance and women. general student body. • Division III places primary emphasis on regional in-season and conference competition, also offering • Enhance formal accountability of thewhile governance structure. 36 • Maintain a balanced budget national championships annually. • Division III affords student-athletes the opportunity to discover valuable lessons in teamwork, discipline, DIVISION III and STUDENT-ATHLETES perseverance leadership, which in turn make student-athletes better students and responsible citizens. • •Division features student-athletes are subject the same standards, ReportIIIparticipating in club sports and who intramural sports attogreater rates admission than the student body. academic standards, •housing Reportand active academic engagement participation in academic such as faculty, study abroad support services as theand general student body. The“extras,” integration of research athleticswith with the larger institution opportunities and capstone/senior thesis projects. enables student-athletes to experience all aspects of campus life. • • • • • Are more likely to report “leadership potential” as an important consideration in choosing a career. Report significantly greater gains in time management when compared with the student body. Report greater involvement in volunteering. Are more likely to report that they see themselves as part of the campus community. Have equal opportunity and access to financial aid as the general student body – but are not awarded aid based on athletics leadership, ability, performance or participation. Three-quarters of all student-athletes in Division III receive some form of grant or non-athletics scholarship. 2015-16 Budget Facts REVENUE CHAMPIONSHIPS (28 DIVISION IIII SPECIFIC) Men’s Budget Revenue Allocation 2013-14 2014-15 2015-16 $26,342,000 $27,117,000 $28,543,836 Source: 3.18% of NCAA operating revenue allocation. BUDGET ALLOCATION BUDGET ALLOCATION 2015-16 Allocation • 75% to championships = $21.3 million. • 25% to nonchampionships = $7 million. Mandated Annual Reserve* • 50% of annual overall budget = $14.8 million, including a $5 million insurance policy. * Source: Presidents Council vote in August 2014. Women’s Budget Baseball Basketball Cross Country Field Hockey Football Golf Ice Hockey Lacrosse Rowing Soccer Softball Swimming and Diving Tennis Indoor Track and Field Outdoor Track and Field Volleyball Wrestling $1,891,000 $ 997,000 $ 541,000 NA $1,820,000 $ 541,000 $ 316,000 $ 446,000 NA $1,046,000 NA $ 513,000 $ 615,000 $ 569,000 $ 771,000 $ 167,200 $ 381,000 NA $1,504,000 $ 561,000 $ 431,000 NA $ 321,000 $ 286,000 $ 727,000 $ 305,000 $1,227,000 $1,418,000 $ 525,000 $ 647,000 $ 617,000 $ 807,000 $ 999,000 NA Overall Totals $10,614,200 $10,375,000 MEMBERSHIP DUES MEMBERSHIP DUES NONCHAMPIONSHIP INITIATIVES 450 Total Members. $900 annual dues = $405,000 NONCHAMPIONSHIPS INITIAT2015-16 Budget 43 Division III voting conferences. $450 annual dues = $19,350 21 Division III nonvoting conferences. $450 annual dues = $9,450 Annual dues generate $433.8K of Association-wide revenue. Division III receives 3.18% = $13,795. VALUE OFOF MEMBERSHIP VALUE MEMBERSHIP With an annual average budget of $29 million and annual membership dues of $900 or less, the estimated per institution value of Division III membership is $56,420 annually. DIVISION III STAFF SUPPORT DIVISION III STAFF SUPPORT Overall, of 514 NCAA staff members, 38 support Division III directly. Full time, 100% Division III support = 14. (Does not include administrative assistants). Governance: 4 Championships: 4 AMA: 5 Research: 1 Conference Grant Program Women & Minority Intern Program Strategic Alliance Matching Grant Division III Identity Program 360 Proof Student-Athlete Leadership Conference FAR Institute ADR Institute Campus-based Programs - DISC NADIIIAA Partnership Special Olympics Partnership Diversity Programming Co-SIDA Academic All-America Program Annual Convention NACWAA Enhancement Grant Program Miscellaneous Division III Initiatives Voluntary Grad Rate Reporting Honorarium Working Groups Conference Commissioners Meeting $2,541,000 $ 890,000 $ 600,000 $ 446,000 $ 200,000 $ 365,000 $ 80,000 $ 80,000 $ 80,000 $ 52,000 $ 35,000 $ 231,000 $ 44,000 $ 70,000 $ 28,000 $ 10,000 $ 25,000 $ 21,000 $ 20,000 Sportsmanship Initiative $ Other $ 120,000 Overall Total $5,988,000 50,000


