Set Theory: Shading Venn Diagrams
advertisement
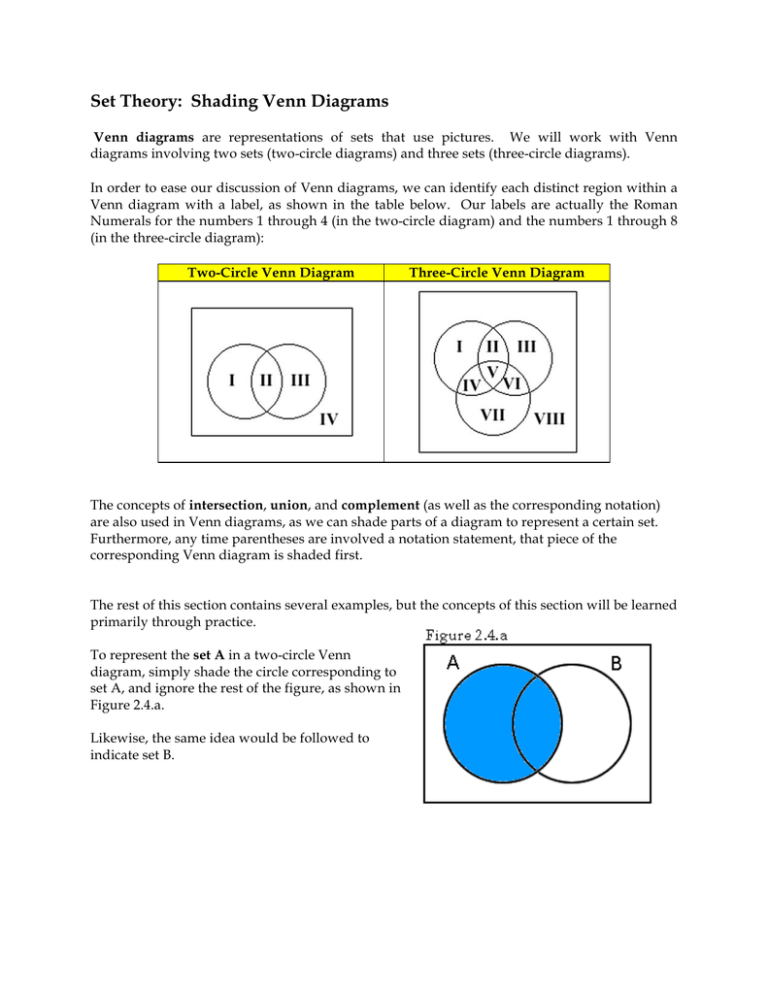
Set Theory: Shading Venn Diagrams Venn diagrams are representations of sets that use pictures. We will work with Venn diagrams involving two sets (two-circle diagrams) and three sets (three-circle diagrams). In order to ease our discussion of Venn diagrams, we can identify each distinct region within a Venn diagram with a label, as shown in the table below. Our labels are actually the Roman Numerals for the numbers 1 through 4 (in the two-circle diagram) and the numbers 1 through 8 (in the three-circle diagram): Two-Circle Venn Diagram Three-Circle Venn Diagram The concepts of intersection, union, and complement (as well as the corresponding notation) are also used in Venn diagrams, as we can shade parts of a diagram to represent a certain set. Furthermore, any time parentheses are involved a notation statement, that piece of the corresponding Venn diagram is shaded first. The rest of this section contains several examples, but the concepts of this section will be learned primarily through practice. To represent the set A in a two-circle Venn diagram, simply shade the circle corresponding to set A, and ignore the rest of the figure, as shown in Figure 2.4.a. Likewise, the same idea would be followed to indicate set B. Example 1: Create a Venn diagram for the set A ∩ B. While we may be able to visualize the set A ∩ B in the diagram right away, let’s take a look at a step-by-step approach. That process looks a little bit like a cartoon strip. To represent the set A ∩ B in a two-circle Venn diagram, start by lightly shading the set A. We will do this with vertical lines, as shown in Figure 2.4.b. Next, shade set B with horizontal lines, as shown in Figure 2.4.c. The cross-hatched, football-shaped region in the center represents where the shadings overlap. Since we are trying to shade ONLY the intersection of these two sets, we finish our diagram by darkly shading the overlap of the two sets, and erasing the parts of sets A and B that are not in the overlap. This is shown in Figure 2.4.d. Example 2: Create a Venn diagram for the set A’ ∪ B. Again, we may be able to visualize the set A’ ∪ B and draw the diagram right away. This is just fine, but for some the step-by-step approach will be helpful. Start by lightly shading the set A’ with vertical lines, as shown in Figure 2.4.e. Next, shade set B with horizontal lines. Like before, the crosshatched region represents where the shadings overlap, as shown in Figure 2.4.f. Since we are trying to shade the union of these two sets, we finish our diagram by joining the sets together. That is, we darkly shade everything we shaded in the previous image. This is shown in Figure 2.4.g. Just like we saw with two-circle Venn diagrams, to represent the set A in a three-circle Venn diagram, we simply shade the circle corresponding to set A, and ignore the rest of the figure, as shown in figure 2.4.h. Likewise, the same idea would be followed to indicate set B or set C. (By the way, can you see why some people refer to these as Mickey Mouse problems?) The creation of more involved three-circle Venn diagrams is very similar to the process we followed for two-circle Venn diagrams. They are just a little longer. When considering the Venn diagram representation for the union and/or intersection of more than two sets, just like with the arithmetic order of operations, we need to work from left to right. And, once again, similar to the arithmetic order of operations, the only time we make an exception to the left-to-right process is when parentheses are used to group a specific operation. Just like the arithmetic expressions “10 – 2 + 5” and “10 – (2 + 5)” simplify to two different values, the sets “A ∩ B ∪ C” and “A ∩ (B ∪ C)” will yield two different Venn diagrams. Example 3: Create a three-circle Venn diagram for the set A ∩ B ∪ C. Again, some of us may be able to visualize all or part of this diagram right away. If that is true, great. If not, fall back on a step-by-step approach. Start by shading the set A with vertical lines, as shown in Figure 2.4.i. Next, shade set B with horizontal lines, as shown in Figure 2.4.j. Once again, the crosshatched, football-shaped region represents where the shadings overlap. We’re not done yet; we’ve only shown the first half. At this point we use that overlap and have shaded the set A ∩ B, as shown in Figure 2.4.k. Then we have to show the union of that football-shaped region with set C. So, we let the previously determined region be shaded with vertical lines, and then shade set C with horizontal lines, as shown in figure 2.4.l. Finally, since we are trying to shade the union in this last step, we finish our diagram by joining the sets together. That is, we simply shade everything that was shaded in the previous image. The final image looks like Figure 2.4.m. Example 4: Create a three-circle Venn diagram for the set A ∩ (B ∪ C). This time, because of the parentheses, we have to consider (B ∪ C) first. Thus, start by shading set B, as shown in Figure 2.4.n. Next, we shade set C, as shown in Figure 2.4.o. Once again, the crosshatched region represents where the shadings overlap. Since we want the union of these two sets, we now join the sets together and have shaded B ∪ C. Next, we need to find the intersection of B ∪ C and set A. So, we take the horizontal shading of B ∪ C, as shown in Figure 2.4.p, and then shade set A with vertical lines, as shown in Figure 2.4.q. Finally, since we are trying to shade the intersection, in this last step we finish our diagram by shading only the overlap from the previous image. The Venn diagram looks like Figure 2.4.r. Example 5: Create a three-circle Venn diagram for the set B’ ∩ (A ∪ C). Because of the parentheses, we must consider A ∪ C first. So, start by shading set A, as shown in Figure 2.4.s. Next, we shade set C, as shown in Figure 2.4.t. Since we want A ∪ C, we join the sets together, as shown in Figure 2.4.u. Next, we shade the set B’, as shown in Figure 2.4.v. Finally, since we are trying to shade the intersection in this last step, we finish our diagram by shading only the overlap from the previous image. The final image looks like Figure 2.4.w.
