Collecting data - CTA Publishing
advertisement

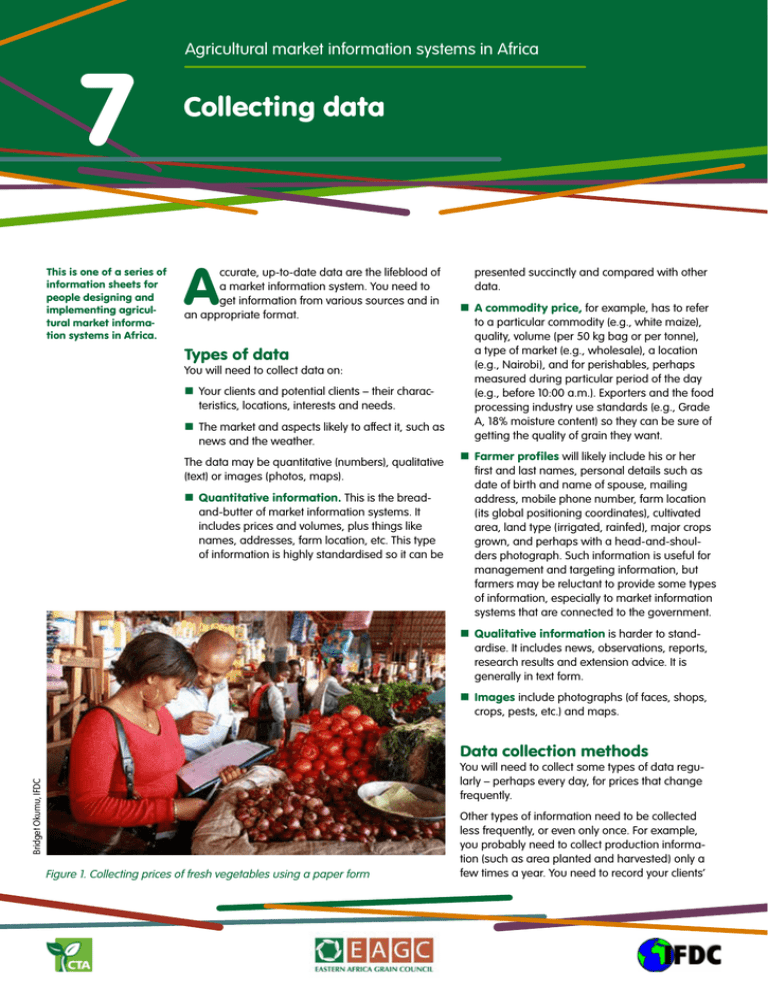
7 This is one of a series of information sheets for people designing and implementing agricultural market information systems in Africa. Agricultural market information systems in Africa Collecting data A ccurate, up-to-date data are the lifeblood of a market information system. You need to get information from various sources and in an appropriate format. Types of data You will need to collect data on: Your clients and potential clients – their characteristics, locations, interests and needs. The market and aspects likely to affect it, such as news and the weather. The data may be quantitative (numbers), qualitative (text) or images (photos, maps). Quantitative information. This is the breadand-butter of market information systems. It includes prices and volumes, plus things like names, addresses, farm location, etc. This type of information is highly standardised so it can be presented succinctly and compared with other data. A commodity price, for example, has to refer to a particular commodity (e.g., white maize), quality, volume (per 50 kg bag or per tonne), a type of market (e.g., wholesale), a location (e.g., Nairobi), and for perishables, perhaps measured during particular period of the day (e.g., before 10:00 a.m.). Exporters and the food processing industry use standards (e.g., Grade A, 18% moisture content) so they can be sure of getting the quality of grain they want. Farmer profiles will likely include his or her first and last names, personal details such as date of birth and name of spouse, mailing address, mobile phone number, farm location (its global positioning coordinates), cultivated area, land type (irrigated, rainfed), major crops grown, and perhaps with a head-and-shoulders photograph. Such information is useful for management and targeting information, but farmers may be reluctant to provide some types of information, especially to market information systems that are connected to the government. Qualitative information is harder to standardise. It includes news, observations, reports, research results and extension advice. It is generally in text form. Images include photographs (of faces, shops, crops, pests, etc.) and maps. Data collection methods Bridget Okumu, IFDC You will need to collect some types of data regularly – perhaps every day, for prices that change frequently. Figure 1. Collecting prices of fresh vegetables using a paper form Other types of information need to be collected less frequently, or even only once. For example, you probably need to collect production information (such as area planted and harvested) only a few times a year. You need to record your clients’ Figure 2. The data collection method depends on the type of data Regular, frequent Irregular, infrequent Primary Sources Sources Regular enumeration Crowdsourcing Secondary Sources Exchanges Warehouses Millers and processors Weather services Government News agencies Cloud services Data types Prices, volumes Data types Prices, volumes Weather Production problems News names and addresses only once, and update the information only if it changes (Figure 2). You will have to gather certain types of data yourself by asking traders or clients, or by observing the subject-matter directly. These are known as primary data. You can also gather other types of data from existing datasets, such as the government, weather services, commodity exchanges and warehouses. These are known as secondary data. Primary data You can collect primary data in various ways. Regular enumeration. Enumerators are individuals who collect data on things like commodity prices and volumes. Some go to the marketplace each day and gather prices from buyers or sellers. Others monitor border crossings or key trade routes, noting the type and volume of items going each way. Still others check the amount entering and leaving warehouses or wholesalers. You will have to pay the enumerators for their services. You may employ them directly (perhaps parttime) or pay them a fee for the data they collect. Or you may pay organisations such as a warehouse or wholesaler to send you information that they gather anyway. Crowdsourcing. It may be possible to get large numbers of people to provide you with data. You can do this in two ways: Get them to enter the prices of products voluntarily (for example in a smartphone app). You will need to give them an incentive (such as a payment) to collect the information for you. Direct observation Personal interviews Focus groups Client registration Surveys Data types Sources Data types Government International agencies Experiments, tests Outsourced surveys Satellite imagery Mapping services Census data Early warning Crop varieties Market research Locations, areas, boundaries, routes Production status Problems, needs Names, addresses While the information is not as accurate as using trained enumerators, the larger number of people reporting data means that errors will tend to cancel each other out. If your platform includes a “matchmaking” feature that enables buyers and sellers to meet up and arrange a trade, you can cull information on prices automatically. Such information is much more accurate because it is based on actual trades. Direct observation. Go into the field: what crop is growing? How mature is it? What pest and disease problems does it have? Go into a market: what commodities are being traded? What do the price tags say? Is the price going up or down? Such observations can be valuable to plan what the enumerators monitor, and to validate and enrich other types of data that are collected more systematically. Personal interviews and focus groups allow you to get in-depth information from farmers, traders and others. They are especially useful early on when you are designing the information services that you a planning to offer. Client registration and interaction. When you sign up new clients for your service, you will gather information about them: their name, phone number, location, etc. You may also ask them for details such as their farm size and the main crops they grow so you can tailor the information services they receive. As they interact with the market information service, they will also automatically generate a continuous flow of new information that you can use to update their profile. Surveys. One-off surveys can generate information on farmers, farms, soils, dealerships, etc. Including geographical coordinates makes it possible to locate each site or respondent. Some information may already be available from other sources. Why might you want to go to the trouble of collecting it again yourself? Doing so makes sense only if there is a pressing need: the data quality is not good enough, if the data owner will not let you use the information, or if the owner wants to charge too much. Some existing information may in theory be public and freely available, but in practice it can be hard to get. Measuring cross-border trade Measuring cross-border trade is a special challenge. For a private company it is impractical to stop and question people or inspect vehicles as they go from one country to another. The government may have the power to do so, but trade data are notoriously inaccurate – as shown by the difference between the exports officially recorded on one side of a border and the imports on the other side. The best you can do is to have an enumerator at the border to note the magnitude and direction of the flow, count the type and number of vehicles carrying goods, and if possible determine the nature of the commodity being transported. See Nzuma et at. (2012) for more. Secondary data Good-quality secondary data are valuable. Even if your clients can get such information elsewhere, you may still want to provide it so you can become a one-stop shop for information they find useful. The government may collect and provide some types of information; you may be able to get this for free. You will probably have to pay for information that comes from commercial sources. You may be able to obtain secondary data automatically through an API, or “application program interface”. This is a program that taps into a source database, extracts the elements that you want, and puts them into a format that you can use. This avoids the delays and errors that come with re-entering the data. Bridget Okumu, IFDC Government information may be unreliable and out of date, so be careful to check the quality before using it. The same goes for data that are based on government sources, such as that published by FAOSTAT, the statistics service of the Food and Agriculture Organization of the United Nations. An enumerator monitoring traffic at the Kenya–Uganda border Below are the main secondary sources of data you may want to use. Commodity exchanges and warehouses automatically record details of each transaction: the type of commodity, grade, quantity traded and price. Weather services monitor the current weather, prepare short- and long-term forecasts, and have a wealth of historical data to draw on. Government. Various government departments and local government units gather data that you may be able to access. They include prices, volumes and trades, registration information on agro-dealers and other companies, and information on policies and laws. Cloud services. A number of companies are building databases containing reliable data, based in the “cloud” – i.e., in an internet server Bridget Okumu, IFDC Millers and processors usually announce their buying price outside the mill or factory, or when they respond to a phone call. Traders crossing a border with commodities Table 1. Steps in setting up an enumeration system to collect market prices Step Examples Notes 1. Select the products you want to collect prices for Maize, sorghum, millet, cattle, eggs, tomatoes, onions… What products are your intended clients interested in? 2. Decide what type of market you want to collect the data from Local market, assembly market, warehouse, processing factory, wholesale market, retail market, retail shop Prices are lowest at local markets and highest in retail shops. Check whether your clients are interested in the wholesale or retail price 3. Specify the characteristics of the product Shelled white maize: grade A, 18% moisture content Many products are priced by quality. If a market uses standard grades, use them 4. Specify the units of measure Per kg, per 50 kg bag, per tonne… If necessary collect two units (the local measure and kilograms) to avoid confusion. Beware of non-standard measures, such as tins and bags, and the frequent practice of adding a little extra to a container 5. Decide which (and how many) markets you want to collect data from One, several Collecting data from every market would be impractical and costly, so choose those that are strategically located and of most interest to your clients 6. Decide how frequently you want to collect the data Every day, once a week, once a month… This depends on the frequency of periodic markets and how volatile the prices are 7. Decide what months to collect prices for that product All year round, only during the market season Some products may be on offer only in certain seasons 8. Decide how many observations to make Five observations with different traders You can calculate the average price 9. Decide what time of day to collect the data 10:00 a.m. Prices may vary significantly during the day 10.Decide how to collect the data Check price tags on product, observe actual transactions, ask buyers, ask sellers Find out what best reflects the actual price 11. Design and test a form to collect the data Pen-and-paper, on-screen Pen-and-paper is cheaper to begin with, but means data has to be re-entered and may lead to errors 12.Revise the form and specifications if necessary Find out what is practical 13.Train enumerators Make sure they all follow the correct procedures 14.Implement Start collecting data that you can access. Some are available for free; others require a payment. News agencies generate a continuous flow of local and world news and market data. These agencies include national news services and transnational providers such as Reuters and Bloomberg. Some of it is useful background for your market analysis. International agencies such as the Food and Agriculture Organization and the Famine Early Warning System (www.fews.net) gather and analyse a wide range of data on crop and livestock production, soil moisture and vegetation cover, as well as food availability, prices and trade. Experiments and tests. These generate information about the performance of crop varieties, fertilisers, planting methods, etc. They are usually done by research firms, research institutes or universities. Outsourced surveys. You probably want to develop the capacity to run surveys yourself. But if you do not yet have the in-house expertise, you can collaborate with or outsource these to research firms or universities. Satellite imagery is useful for things like weather, land use and water availability. Providers such as NASA and the European Space Agency offer data and analysis services. Mapping services are the basis for infromation that is “geo-referenced” (comes with the location of farms, dealers, warehouses, etc.). Providers include Google maps and Bing. Enumeration You need to collect information on prices from the local markets. Table 1 gives some ideas on how to do this. Enumerators You will need a team of enumerators to gather the data from markets. You may employ your own staff or pay individuals such as farmers and traders to collect information for you. You need to train the enumerators in the correct way to collect data. Different methods can lead to very different results. For example, prices for fresh vegetables may vary wildly throughout the day: Figure 3. Example of an input price sheet in Microsoft Excel high in the morning when the product is fresh, and low in the afternoon when vendors have only low-quality produce left and want to get home. An enumerator who starts work in the afternoon will report lower prices than someone who is up early in the morning. Each enumerator should follow the same procedures to eliminate such “interviewer bias”. You can reduce the likelihood of error as much as possible by requiring each enumerator to make five observations for each price: by asking three pre-selected traders, and by choosing two other traders at random. Traders get tired of being asked the same question every day, and enumerators get tired of asking them. So make sure you check the performance of the enumerators regularly. Call selected traders independently to verify prices. Give the enumerators encouragement and feedback to maintain their motivation. You can offer them a free subscription to the data service as part of their incentive package. Or you can try giving them money to buy the products in question. That leads to bargaining and a realistic price – not the first price the trader asks for. Check with them about problems they may encounter in their work. Provide refresher training to update them on requirements, inform them about changes in the types of data to collect, and introduce new technologies such as tablet- or mobilephone-based forms. Paper or silicon? Paper-based forms are quick, cheap and easy to produce, familiar, and (if well-designed) easy to fill in. But they have two big disadvantages: Delay. It takes time to send the information to the data centre by fax or courier, then to keyboard the data. Errors. The data must be re-entered – which may lead to typos. The form may be incorrectly filled in, and the enumerator’s handwriting may be illegible. Tablet- or mobile-phone-based systems eliminate both of these problems. The enumerator enters the data directly on screen – so illegible handwriting is not a problem. The form can be designed to query entries that are incomplete, unlikely or impossible, or that cannot be processed (for example, text entries in a numbers-only field). And the enumerator can upload the data to the internet immediately a connection is available. Devices have other advantages. They can be used to gather a wide range of different types of data, and the form can be varied in real time depending on what has been entered. Tablets and mobile phones have built-in cameras – so the enumerator can take a photograph of a commodity, a person or a plant. They can be programmed to report the location – so eliminating the risk that the enumerator has made the data up at home. Nevertheless, devices have disadvantages. The most obvious is the up-front cost: a programmer must write the application; the enumerator must be equipped with the device and trained how to use it. Devices can get lost, stolen, dropped or rained on. And big chunks of Africa are still without both electricity and mobile connectivity. But the problems are diminishing by the day: applications are getting better designed and easier to use, the price of devices is falling, and phone companies are erecting transmission masts across the continent. Technologies such as Bluetooth allow data to be transferred automatically from many markets and commodities as you can, to cover all the different grades of each commodity, and generate frequent updates. Cost. And of course the data collection has to be as cheap as possible so your clients can afford the service. Data quantity Unfortunately it is not possible to achieve all three of these goals at the same time. Collecting lots of top-quality data (and checking that they are indeed top-quality) will be too expensive. So you have to find a happy balance between the three goals. Data quality For quality: remember that absolute accuracy is not possible: prices change all the time, and you cannot control many sources of error. It may be better to be roughly right than precisely wrong. Cost Figure 4. You need to find a balance between the goals of high quality, high quantity, and the cost of collection and analysis an enumerator’s device to a supervisor’s and then uploaded when the supervisor arrives in a location with a mobile connection. The quality–quantity– cost balancing act When collecting data, you have three goals: data quality, data quantity and cost (Figure 4). Data quality. Of course you want your data to be as accurate and reliable and up-to-date as possible! And they must be meaningful and relevant to your users. Data quantity. Of course you want to collect as much data as possible! You want to cover as For quantity: select your locations and commodities carefully. Prices in one location may closely follow those in a nearby market, so it is not necessary to collect data in both places. Prices of grade B maize may always be a few cents or shillings lower than prices for grade A. So you do not need to track the lower grade. Reducing the quality and quantity demands to within acceptable limits will enable you to cut your costs. You may also be able to save by investing in training enumerators and equipping them with electronic devices to gather data. It may seem a paradox, but you may be able to save tomorrow by investing today. More information Nzuma, J., G.M. Masila, and J.K. Ngombalu. 2012. A regional harmonised data collection methodology for informal cross-border trade monitoring in the Eastern and Southern Africa. A user’s manual. Eastern Africa Grain Council, Nairobi. Agricultural market information systems in Africa Sheets in this series 1. 2. 3. 4. 5. 6. 7. 8. 9. 10. 11. 12. Introduction to agricultural market information systems Developing an agricultural market information system Identifying clients and planning services Deciding on your business model Choosing the right technology Choosing and working with partners Collecting data Data analysis and packaging Disseminating information to your clients Marketing your market information service Data: Ethical and legal issues Role of donors and NGOs Download these sheets from publications.cta.int Published 2015 by the Technical Centre for Agricultural and Rural Cooperation (CTA), www.cta.int, in collaboration with the Eastern Africa Grain Council (EAGC), www.eagc.org, and the International Fertilizer Development Center (IFDC), www.ifdc.org This work is licensed under a Creative Commons Attribution-ShareAlike 4.0 International Licence, creativecommons.org/licenses/ by-sa/4.0/ Coordination: Vincent Fautrel, CTA Editing and layout: Paul Mundy, www.mamud.com Technical inputs: Ben Addom, Robert Kintu, Bridget Okumu, Andrew Shepherd, and participants at the IFDC/EAGC/CTA International Workshop on Market Information Systems and ICT Platforms for Business Management across the Value Chain, Arusha, Tanzania, December 2014.


