Computation of Signal–to–Noise Ratios, pp. 105-110
advertisement
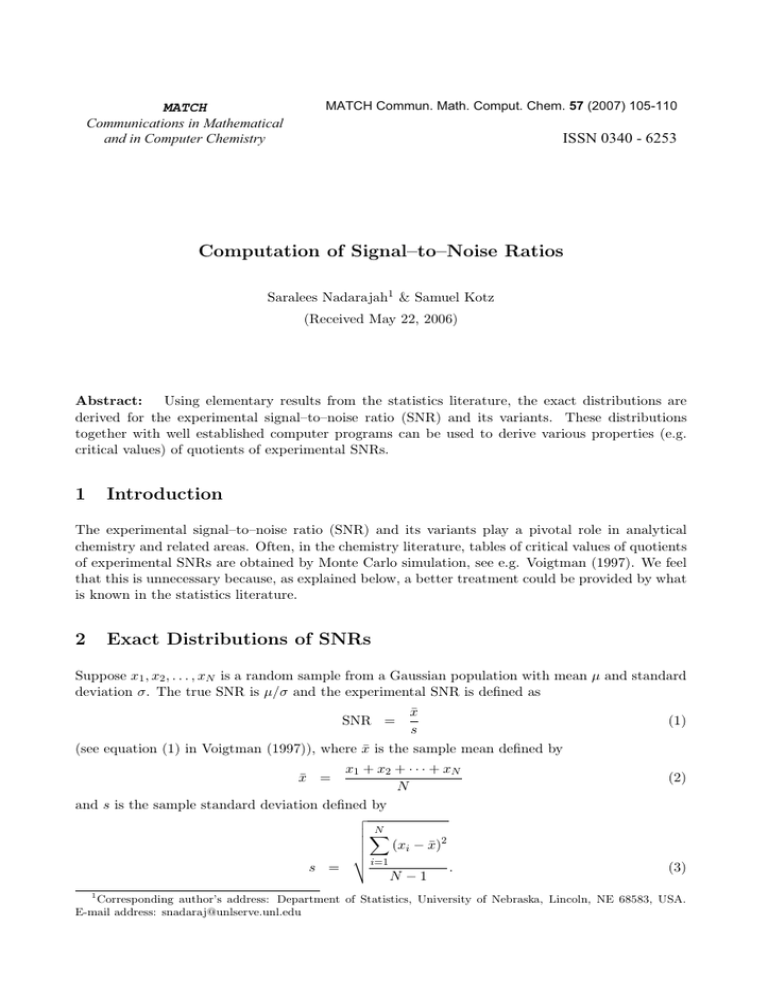
MATCH Communications in Mathematical and in Computer Chemistry MATCH Commun. Math. Comput. Chem. 57 (2007) 105-110 ISSN 0340 - 6253 Computation of Signal–to–Noise Ratios Saralees Nadarajah1 & Samuel Kotz (Received May 22, 2006) Abstract: Using elementary results from the statistics literature, the exact distributions are derived for the experimental signal–to–noise ratio (SNR) and its variants. These distributions together with well established computer programs can be used to derive various properties (e.g. critical values) of quotients of experimental SNRs. 1 Introduction The experimental signal–to–noise ratio (SNR) and its variants play a pivotal role in analytical chemistry and related areas. Often, in the chemistry literature, tables of critical values of quotients of experimental SNRs are obtained by Monte Carlo simulation, see e.g. Voigtman (1997). We feel that this is unnecessary because, as explained below, a better treatment could be provided by what is known in the statistics literature. 2 Exact Distributions of SNRs Suppose x1 , x2 , . . . , xN is a random sample from a Gaussian population with mean μ and standard deviation σ. The true SNR is μ/σ and the experimental SNR is defined as x̄ s (see equation (1) in Voigtman (1997)), where x̄ is the sample mean defined by SNR = x1 + x2 + · · · + xN N and s is the sample standard deviation defined by N (xi − x̄)2 i=1 s = . N −1 x̄ = (1) (2) (3) 1 Corresponding author’s address: Department of Statistics, University of Nebraska, Lincoln, NE 68583, USA. E-mail address: snadaraj@unlserve.unl.edu - 106 Consider also the following variations of (1): SNR = x̄ s (4) and x̄ se (5) s , x̄ (6) x̄2 /s2 , x̄1 /s1 (7) SNRe = as well as the relative standard deviation defined by RSD = √ where s = s (N − 1)/N and se = s/ N . Finally, consider the quotients of SNRs defined by R = ν2 + 1 Re = R ν1 + 1 (8) and Rr = 1 R (9) (see equations (13)–(15) in Voigtman (1997)), where (x̄1 , x̄2 ) are the sample means and (s1 , s2 ) are the sample standard deviations for two independent random samples of size (ν 1 + 1, ν 2 + 1) from a Gaussian population with mean μ and standard deviation σ. The probability distributions of the quantities defined in (1)–(9) can be determined by elementary results in mathematical statistics. Using the sampling theory for the Gaussian distribution, √ one can determine that x̄ has the Gaussian distribution with mean μ and standard deviation σ/ N independently of s. We write σ , (10) x̄ ∼ N μ, √ N where “∼” has the meaning “has the same distribution as.” Using the fact that N (xi − x̄)2 ∼ σ 2 χ2N −1 , i=1 where χ2ν denotes the well–known chi–square distribution with degrees of freedom ν, one see that σ 2 χ2N −1 s ∼ N −1 σχ (11) ∼ √ N −1 , N −1 s ∼ ∼ √ N − 1s √ N σχN −1 √ , N (12) - 107 and se ∼ ∼ s √ N σχ N −1 . N (N − 1) (13) The exact distributions of the SNRs given by (1) and (4)–(6) can be determined by using the definition of the non–central t distribution. If X is a Gaussian random variable with mean δ and unit standard deviation and Y ∼ χ2ν is independent of X then X T = Y /ν ∼ tν,δ (14) is said to have the well–known non–central t distribution with degrees of freedom ν and non– centrality parameter δ. The probability density function (pdf) of T is given by fT (t) = √ j (1+ν)/2 ∞ exp −δ 2 /2 Γ ((1 + ν)/2) ν Γ ((1 + ν + j)/2) tδ 2 √ (15) j!Γ ((1 + ν)/2) πνΓ (ν/2) ν + t2 ν + t2 j=0 for t > 0 (see Johnson et al. (1995)). Using (10)–(13) and (14), one can determine that √ N μ, σ/ N √ SNR ∼ (σ/ N − 1)χN −1 √ √ (σ/ N )N ( N /σ)μ, 1 √ ∼ (σ/ N − 1)χN −1 √ 1 N ( N /σ)μ, 1 √ ∼ √ N (1/ N − 1)χN −1 1 ∼ √ tN −1,√N μ/σ , N SNR ∼ ∼ ∼ ∼ SNRe ∼ √ N μ, σ/ N √ (σ/ N )χN −1 √ √ (σ/ N )N ( N /σ)μ, 1 √ (σ/ N )χN −1 √ N ( N /σ)μ, 1 1 √ √ N − 1 (1/ N − 1)χN −1 1 √ √ , t N − 1 N −1, N μ/σ √ N μ, σ/ N (σ/ N (N − 1))χN −1 (16) (17) - 108 √ √ (σ/ N )N ( N /σ)μ, 1 ∼ (σ/ N (N − 1))χN −1 √ N ( N /σ)μ, 1 √ ∼ (1/ N − 1)χN −1 ∼ tN −1,√N μ/σ , (18) and 1/RSD ∼ 1 √ tN −1,√N μ/σ . N (19) PDF 0.0 1.0 2.0 3.0 PDF The corresponding pdfs in the √ (15). The√pdfs of SNR, SNR , √ can√be expressed √ √ form of fT (·) given by SNRe and RSD are N fT√( N t), N − 1fT ( N − 1t), fT (t) and ( N /t2 )fT ( N /t), respectively, with ν = N − 1 and δ = N μ/σ. 0.6 0.8 1.0 1.2 1.4 SNR SNR’ Figure 1. Histograms of simulated data on SNR, SNR , SNRe and RSD superimposed with the exact pdfs given by (16)–(19). We have chosen μ = 1, σ = 1 and N = 100. We now provide a graphical illustration of the exactness of the results in (16)–(19). We simulated 100 samples of x1 , x2 , . . . , xN each with μ = 1, σ = 1 and N = 100. For each sample, we computed x̄ and s and hence SNR, SNR , SNRe and RSD. So, we end up with 100 values of SNR, 100 values of SNR , 100 values of SNRe and 100 values of RSD. Then, we compared the histograms √ 100 √of these values with the corresponding √ exact pdfs, √ i.e. compare the histogram for SNR with N fT ( N t), the histogram for SNR with N −√ 1fT ( N − 1t), the histogram for SNRe with fT (t) and the √ histogram for RSD with ( N /t2 )fT ( N /t). The results are shown in Figure 1. Clearly, the non– central t distribution describes the data remarkably well. The non–central t distribution arises also in other areas of chemistry. See Malcolm (1984) and Li et al. (2001). Finally, consider the quotients of SNRs defined by (7)–(9). It follows immediately from (16)–(19) - 109 that R ∼ ν 1 + 1 tν 2 ,√ν 2 +1μ/σ , ν 2 + 1 tν 1 ,√ν 1 +1μ/σ Re ∼ and 1/Rr ∼ tν 2 ,√ν 2 +1μ/σ tν 1 ,√ν 1 +1μ/σ , ν 1 + 1 tν 2 ,√ν 2 +1μ/σ . ν 2 + 1 tν 1 ,√ν 1 +1μ/σ The corresponding pdfs require the study of the ratio of non–central t random variables. Suppose X ∼ ta1 ,δ1 and Y ∼ ta2 ,δ2 are independent non–central t random variables and let Z = X/Y . Using (15), the pdf of Z can be written as ∞ fZ (z) = tfX (t)fY (zt)dt 0 = a /2 a /2 a11 a22 exp −δ 21 /2 − δ 22 /2 πΓ (a1 /2) Γ (a2 /2) √ j √ k δ 2 2 tj+k+1 Γ ((1 + a1 + j)/2) Γ ((1 + a2 + k)/2) δ 1 2 dt × j+(a +1)/2 k+(a 1 2 +1)/2 0 j=0 k=0 a2 + z 2 t2 j!k! a1 + t2 a /2 a /2 a11 a22 exp −δ 21 /2 − δ 22 /2 πΓ (a1 /2) Γ (a2 /2) √ j √ k ∞ ∞ Γ ((1 + a1 + j)/2) Γ ((1 + a2 + k)/2) δ 1 2 δ2 2 × j!k! j=0 k=0 ∞ tj+k+1 × k+(a2 +1)/2 dt j+(a +1)/2 1 0 a1 + t2 a2 + z 2 t2 a /2 a /2 a11 a22 exp −δ 21 /2 − δ 22 /2 2πΓ (a1 /2) Γ (a2 /2) √ j √ k ∞ ∞ Γ ((1 + a1 + j)/2) Γ ((1 + a2 + k)/2) δ 1 2 δ2 2 × j!k! j=0 k=0 ∞ w(j+k)/2 × k+(a2 +1)/2 dw 0 (a1 + w)j+(a1 +1)/2 a2 + z 2 w a /2 a /2 a11 a22 exp −δ 21 /2 − δ 22 /2 2πΓ (a1 /2) Γ (a2 /2) √ j √ k ∞ ∞ Γ ((1 + a1 + j)/2) Γ ((1 + a2 + k)/2) δ 1 2 δ2 2 I(j, k). (20) × j!k! = = = ∞ ∞ ∞ j=0 k=0 By equation (2.2.6.24) in Prudnikov et al. (1986), the integral I(j, k) can be calculated as j + k j + k + a1 + a2 (1−j+k−a1 )/2 −k−(a2 +1)/2 , I(j, k) = a1 a2 B 1+ 2 2 - 110 a2 + 1 a1 + a2 a1 z 2 j+k ,k + ;j + k + 1 + ;1 − × 2 F1 1 + , 2 2 2 a2 where B(a, b) = 1 wa−1 (1 − w)b−1 dw 0 is the beta function and 2 F1 (a, b; c; x) = ∞ (a)k (b)k xk k=0 (c)k k! , is the Gauss hypergeometric function, where (z)k = z(z +1) · · · (z +k −1) denotes the ascending factorial. as (ν 2 + 1)/(ν 1 + 1) Using the result in (20), the pdfs of 2R,Re and 1/Rr can be expressed 1) fZ ( (ν 2 + 1)/(ν 1 + 1)(1/z)), refZ ( (ν 2 + 1)/(ν 1 + 1)z), fZ (z) and (1/z √ ) (ν 2 + 1)/(ν 1 + √ spectively, with a1 = ν 2 , a2 = ν 1 , δ 1 = ν 2 + 1μ/σ and δ 2 = ν 1 + 1μ/σ. 3 Conclusions We have derived the exact distributions of the SNRs and their quotients (equations (1) and (4)– (9)) by using the established properties of the non–central t distribution. The exactness of the distributions has been verified by simulation. The non–central t distributions have been known since the early 1900s and their properties have been studied extensively in the statistics literature. The reader is referred to Chapter 31 of Johnson et al (1995) for the most up–to–date details on the distributions. Computer programs for evaluating the non–central t distributions are also widely available (e.g. in R, a freely downloadable statistical software) and these programs can be used to produce e.g. accurate tables of critical values without the need for Monte Carlo simulation. Acknowledgments The authors would like to thank the editor and the two referees for carefully reading the paper and for their comments which greatly improved the paper. References Johnson, N. L., Kotz, S. and Balakrishnan, N. (1995). Continuous Univariate Distributions (volume 2, second edition). John Wiley and Sons, New York, NY. Le, S. -Y., Liu, W. -M., Chen , J. -H. and Maizel Jr, J. V. (2001). Local thermodynamic stability scores are well represented by a non–central Student’s t distribution. Journal of Theoretical Biology, 210, 411–423. Malcolm, S. (1984). A note on the use of the non–central t distribution in setting numerical microbiological specifications for foods. Journal of Applied Bacteriology, 57, 175–177. Prudnikov, A. P., Brychkov, Y. A. and Marichev, O. I. (1986). Integrals and Series, volume 1. Gordon and Breach Science Publishers, Amsterdam. Voigtman, E. (1997). Comparison of signal–to–noise ratios. Analytical Chemistry, 69, 226–234.

