E, V vs. Ag/AgCl -0.8
advertisement

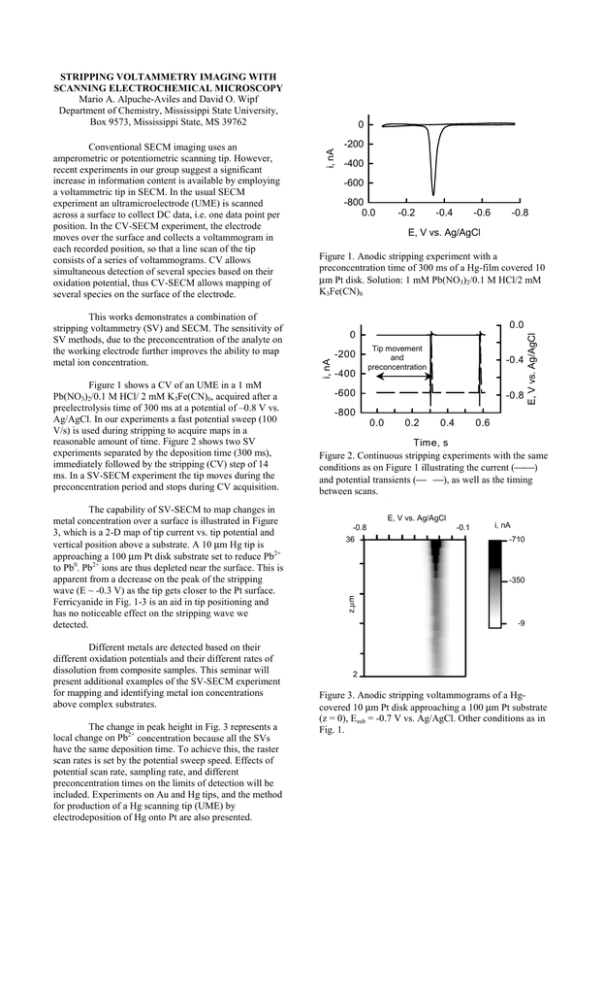
STRIPPING VOLTAMMETRY IMAGING WITH SCANNING ELECTROCHEMICAL MICROSCOPY Mario A. Alpuche-Aviles and David O. Wipf Department of Chemistry, Mississippi State University, Box 9573, Mississippi State, MS 39762 The capability of SV-SECM to map changes in metal concentration over a surface is illustrated in Figure 3, which is a 2-D map of tip current vs. tip potential and vertical position above a substrate. A 10 µm Hg tip is approaching a 100 µm Pt disk substrate set to reduce Pb2+ to Pb0. Pb2+ ions are thus depleted near the surface. This is apparent from a decrease on the peak of the stripping wave (E ~ -0.3 V) as the tip gets closer to the Pt surface. Ferricyanide in Fig. 1-3 is an aid in tip positioning and has no noticeable effect on the stripping wave we detected. Different metals are detected based on their different oxidation potentials and their different rates of dissolution from composite samples. This seminar will present additional examples of the SV-SECM experiment for mapping and identifying metal ion concentrations above complex substrates. The change in peak height in Fig. 3 represents a local change on Pb2+ concentration because all the SVs have the same deposition time. To achieve this, the raster scan rates is set by the potential sweep speed. Effects of potential scan rate, sampling rate, and different preconcentration times on the limits of detection will be included. Experiments on Au and Hg tips, and the method for production of a Hg scanning tip (UME) by electrodeposition of Hg onto Pt are also presented. i, nA -800 0.0 -0.2 -0.4 -0.6 -0.8 E, V vs. Ag/AgCl Figure 1. Anodic stripping experiment with a preconcentration time of 300 ms of a Hg-film covered 10 µm Pt disk. Solution: 1 mM Pb(NO3)2/0.1 M HCl/2 mM K3Fe(CN)6 0.0 0 -200 -400 Tip movement and preconcentration -0.4 -600 -800 -0.8 0.0 0.2 0.4 E, V vs. Ag/AgCl Figure 1 shows a CV of an UME in a 1 mM Pb(NO3)2/0.1 M HCl/ 2 mM K3Fe(CN)6, acquired after a preelectrolysis time of 300 ms at a potential of –0.8 V vs. Ag/AgCl. In our experiments a fast potential sweep (100 V/s) is used during stripping to acquire maps in a reasonable amount of time. Figure 2 shows two SV experiments separated by the deposition time (300 ms), immediately followed by the stripping (CV) step of 14 ms. In a SV-SECM experiment the tip moves during the preconcentration period and stops during CV acquisition. -400 0.6 Time, s Figure 2. Continuous stripping experiments with the same conditions as on Figure 1 illustrating the current () and potential transients ( ), as well as the timing between scans. E, V vs. Ag/AgCl -0.8 36 -0.1 i, nA -710 -350 z,µm This works demonstrates a combination of stripping voltammetry (SV) and SECM. The sensitivity of SV methods, due to the preconcentration of the analyte on the working electrode further improves the ability to map metal ion concentration. -200 -600 i, nA Conventional SECM imaging uses an amperometric or potentiometric scanning tip. However, recent experiments in our group suggest a significant increase in information content is available by employing a voltammetric tip in SECM. In the usual SECM experiment an ultramicroelectrode (UME) is scanned across a surface to collect DC data, i.e. one data point per position. In the CV-SECM experiment, the electrode moves over the surface and collects a voltammogram in each recorded position, so that a line scan of the tip consists of a series of voltammograms. CV allows simultaneous detection of several species based on their oxidation potential, thus CV-SECM allows mapping of several species on the surface of the electrode. 0 -9 2 Figure 3. Anodic stripping voltammograms of a Hgcovered 10 µm Pt disk approaching a 100 µm Pt substrate (z = 0), Esub = -0.7 V vs. Ag/AgCl. Other conditions as in Fig. 1.


