colorstyle
advertisement
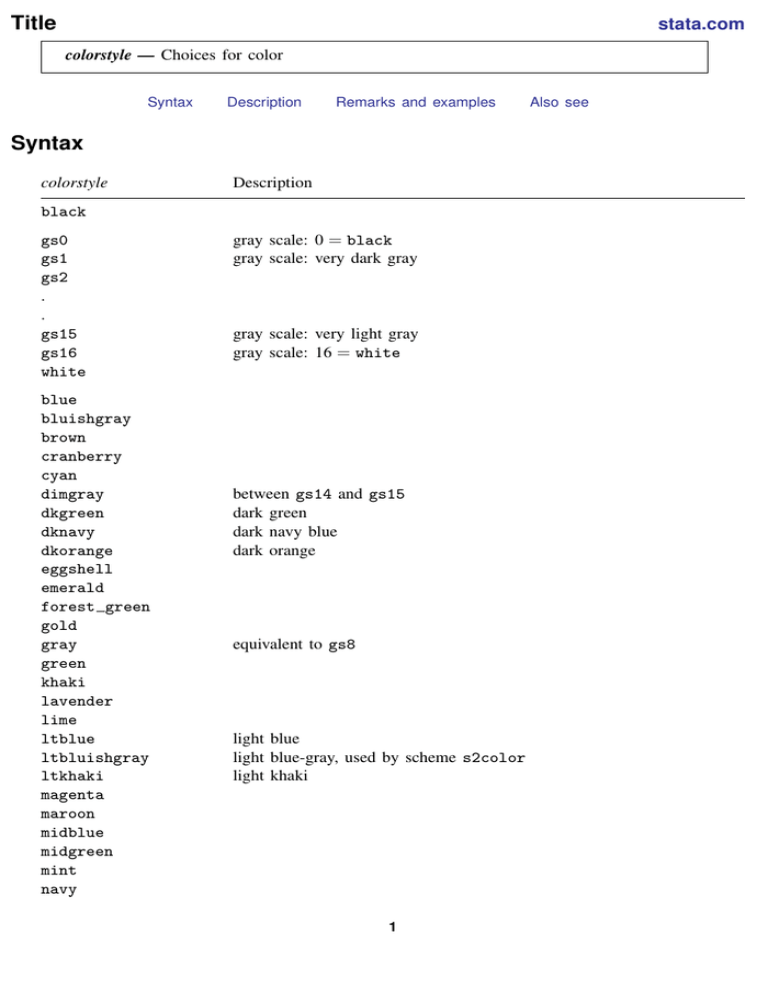
Title stata.com colorstyle — Choices for color Syntax Description Remarks and examples Syntax colorstyle Description black gs0 gs1 gs2 . . gs15 gs16 white blue bluishgray brown cranberry cyan dimgray dkgreen dknavy dkorange eggshell emerald forest green gold gray green khaki lavender lime ltblue ltbluishgray ltkhaki magenta maroon midblue midgreen mint navy gray scale: 0 = black gray scale: very dark gray gray scale: very light gray gray scale: 16 = white between gs14 and gs15 dark green dark navy blue dark orange equivalent to gs8 light blue light blue-gray, used by scheme s2color light khaki 1 Also see 2 colorstyle — Choices for color olive olive teal orange orange red pink purple red sand sandb sienna stone teal yellow bright sand ebg ebblue edkblue eltblue eltgreen emidblue erose colors used by The Economist magazine: background color bright blue dark blue light blue light green midblue rose none background or bg foreground or fg no color; invisible; draws nothing same color as background same color as foreground ### RGB value; white #### CMYK value; yellow hsv # # # HSV value; white color*# color with adjusted intensity *# default color with adjusted intensity = "255 255 255" = "0 0 255 0" = "hsv 255 255 255" When specifying RGB, CMYK, or HSV values, it is best to enclose the values in quotes; type "128 128 128" and not 128 128 128. For a color palette showing an individual color, type palette color colorstyle , scheme(schemename) and for a palette comparing two colors, type palette color colorstyle colorstyle , scheme(schemename) For instance, you might type . palette color red green See [G-2] palette. Wherever a colorstyle appears, you may specify an RGB value by specifying three numbers in sequence. colorstyle — Choices for color 3 Each number should be between 0 and 255, and the triplet indicates the amount of red, green, and blue to be mixed. Each of the colorstyles in the table above is equivalent to an RGB value. You can also specify a CMYK value wherever colorstyle appears, but the four numbers representing a CMYK value must be enclosed in quotes, for example, "100 0 22 50". You can also specify an HSV (hue, saturation, and value) color wherever colorstyle appears. HSV colors measure hue on a circular 360-degree scale with saturation and hue as proportions between 0 and 1. You must prefix HSV colors with hsv and enclose the full HSV specification in quotes, for example, "hsv 180 .5 .5". Other colorstyles may be available; type . graph query colorstyle to obtain the complete list of colorstyles installed on your computer. Description colorstyle specifies the color of a graphical component. You can specify colorstyle with many different graph options; all have the form hobjecticolor(colorstyle) or color(colorstyle) For instance, option mcolor() specifies the color of markers, option lcolor() specifies the colors of connecting lines, and option fcolor() specifies the colors of the fill area. Option color() is equivalent to specifying all three of these options. Anywhere you see colorstyle, you can choose from the list above. You will sometimes see that a colorstylelist is allowed, as in . scatter . . . , msymbol(colorstylelist) . . . A colorstylelist is a sequence of colorstyles separated by spaces. Shorthands are allowed to make specifying the list easier; see [G-4] stylelists. When specifying RGB, CMYK, or HSV values in colorstylelists, remember to enclose the numbers in quotes. Remarks and examples Remarks are presented under the following headings: Colors are independent of the background color White backgrounds and black backgrounds RGB values CMYK values HSV values Adjusting intensity stata.com 4 colorstyle — Choices for color Colors are independent of the background color Except for the colors background and foreground, colors do not change because of the background color. Colors background and foreground obviously do change, but otherwise, black means black, red means red, white means white, and so on. White on a black background has high visibility; white on a white background is invisible. Inversely, black on a white background has high visibility; black on a black background is invisible. Color foreground always has high visibility. Color background is the background color. If you draw something in this color, you will erase whatever is underneath it. Color none is no color at all. If you draw something in this color, whatever you draw will be invisible. Being invisible, it will not hide whatever is underneath it. White backgrounds and black backgrounds The colors do not change because of the background color, but the colors that look best depend on the background color. Graphs on the screen look best against a black background. With a black background, light colors stand out, and dark colors blend into the background. Graphs on paper are usually presented against a white background. Dark colors stand out and light colors blend into the background. Because most users need to make printed copies of their graphs, Stata’s default is to present graphs on a white background, but you can change that; see [G-4] schemes intro. If you want a dark background, it is better to choose a dark background rather than attempt to darken the background by using the region option graphregion(fcolor()) (see [G-3] region options); everything else about the graph’s scheme will assume a background similar to how it was originally. graphregion(fcolor()) (and graphregion(ifcolor()), plotregion(fcolor()), and plotregion(ifcolor())) are best used for adding a little tint to the background. RGB values In addition to colors such as red, green, blue, or cyan, you can mix your own colors by specifying RGB values. An RGB value is a triplet of numbers, each of which specifies, on a scale of 0–255, the amount of red, green, and blue to be mixed. That is, red green blue cyan magenta yellow white black = = = = = = = = 255 0 0 0 255 255 255 0 0 255 0 255 0 255 255 0 0 0 255 255 255 0 255 0 The overall scale of the triplet affects intensity; thus, changing 255 to 128 in all the examples above would keep the colors the same but make them dimmer. (Color 128 128 128 is what most people call gray.) colorstyle — Choices for color 5 CMYK values In addition to mixing your own colors by using RGB values, you can mix your own colors by using CMYK values. If you have not heard of CMYK values or been asked to produce CMYK color separations, you can safely skip this section. CMYK is provided primarily to assist those doing color separations for mass printings. Although most inkjet printers use the more common RGB color values, printing presses almost always require CMYK values for color separation. RGB values represent a mixing of red, green, and blue light, whereas CMYK values represent a mixing of pigments—cyan, magenta, yellow, and black. Thus, as the numbers get bigger, RGB colors go from dark to bright, whereas the CMYK colors go from light to dark. CMYK values can be specified either as integers from 0 to 255, or as proportions of ink using real numbers from 0.0 to 1.0. If all four values are 1 or less, the numbers are taken to be proportions of ink. Thus, 127 0 127 0 and 0.5 0 0.5 0 specify almost equivalent colors. Some examples of CMYK colors are red green blue cyan magenta yellow white black = = = = = = = = 0 255 255 255 0 0 0 0 255 0 255 0 255 0 0 0 255 255 0 0 0 255 0 0 0 0 0 0 0 0 0 255 or, equivalently, or, equivalently, or, equivalently, or, equivalently, or, equivalently, or, equivalently, or, equivalently, or, equivalently, 0 1 1 1 0 0 0 0 1 0 1 0 1 0 0 0 1 1 0 0 0 1 0 0 0 0 0 0 0 0 0 1 For color representation, there is no reason for the K (black) component of the CMYK values, 255 255 255 0 and 0 0 0 255 both specify the color black. With pigments such as printer inks, however, using 100% of cyan, magenta, and yellow rarely produces a pure black. For that reason, CMYK values include a specific black component. Internally, Stata stores all colors as RGB values, even when CMYK values are specified. This allows colors to be easily shown on most display devices. In fact, graph export will produce graph files using RGB values, even when CMYK values were specified as input. Only a few devices and graphics formats understand CMYK colors, with PostScript and EPS formats being two of the most important. To obtain CMYK colors in these formats, use the cmyk(on) option of the graph export command. You can also specify that all PostScript export files permanently use CMYK colors with the command translator set Graph2ps cmyk on or translator set Graph2eps cmyk on for EPS files. Stata uses, for lack of a better term, normalized CMYK values. That simply means that at least one of the CMY values is normalized to 0 for all CMYK colors, with the K (black) value “absorbing” all parts of CM and Y where they are all positive. An example may help: 10 10 5 0 is taken to be the normalized CMYK value 5 5 0 5. That is, all CMY colors were 5 or greater, so this component was moved to black ink, and 5 was subtracted from each of the CMY values. If you specify your CMYK colors in normalized form, these will be exactly the values output by graph export, and you should never be surprised by the resulting colors. HSV values You can also mix your own colors by specifying HSV values. These are also sometimes called HSL (hue, saturation, and luminance) or HSB (hue, saturation, and brightness). An HSV value is a triplet of numbers. The first number specifies the hue and is specified on a circular 360-degree scale. Any number can be specified for the hue, but numbers above 360 are taken as modulo 360. The second number specifies the saturation of the color as a proportion between 0 and 1, and the third number specifies the value (luminance/brightness) between 0 and 1. HSV colors must be prefaced with hsv. 6 colorstyle — Choices for color Some examples of HSV colors are = = = cyan = magenta = yellow = white = black = red green blue hsv 0 hsv 120 hsv 240 1 1 1 1 1 1 hsv 180 hsv 300 hsv 60 hsv 0 hsv 0 1 1 1 0 0 1 1 1 1 0 Putting the primary colors in their HSV hue order, red yellow green cyan blue magenta = = = = = = hsv hsv hsv hsv hsv hsv 0 60 120 180 240 300 1 1 1 1 1 1 1 1 1 1 1 1 With the exception of black, all the listed colors specify a saturation and value of 1. This is because these are the primary colors in the RGB and CMYK spaces and therefore have full saturation and brightness. Reducing the saturation will reduce the amount of color. Reducing the brightness will make the color dimmer. Adjusting intensity To specify a color and modify its intensity (brightness), you might specify things such as green*.8 red*1 purple*1.2 0 255 255*.8 Multiplying a color by 1 leaves the color unchanged. Multiplying by a number greater than 1 makes the color stand out from the background more; multiplying by a number less than 1 makes the color blend into the background more. For an example using the intensity adjustment, see Typical use in [G-2] graph twoway kdensity. When modifying intensity, the syntax is color*# or the color may be omitted: *# If the color is omitted, the intensity adjustment is applied to the default color, given the context. For instance, you specify bcolor(*.7) with graph twoway bar—or any other graph twoway command that fills an area—to use the default color at 70% intensity. Or you specify bcolor(*2) to use the default color at twice its usual intensity. When you specify both the color and the adjustment, you must type the color first: .8*green will not be understood. Also, do not put a space between the color and the *, even when the color is an RGB or CMYK value. colorstyle — Choices for color 7 color*0 makes the color as dim as possible, but it is not equivalent to color none. color*255 makes the color as bright as possible, although values much smaller than 255 usually achieve the same result. Also see [G-2] palette — Display palettes of available selections [G-4] schemes intro — Introduction to schemes


