AP Physics B Lab Report Template
advertisement

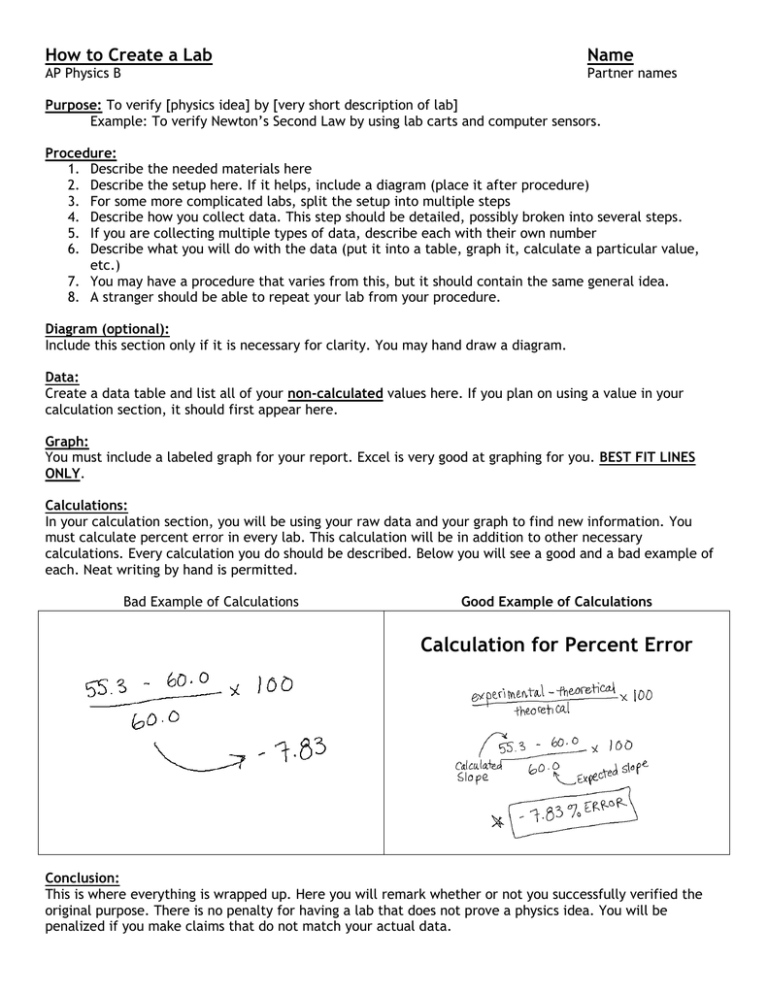
How to Create a Lab Name AP Physics B Partner names Purpose: To verify [physics idea] by [very short description of lab] Example: To verify Newton’s Second Law by using lab carts and computer sensors. Procedure: 1. Describe the needed materials here 2. Describe the setup here. If it helps, include a diagram (place it after procedure) 3. For some more complicated labs, split the setup into multiple steps 4. Describe how you collect data. This step should be detailed, possibly broken into several steps. 5. If you are collecting multiple types of data, describe each with their own number 6. Describe what you will do with the data (put it into a table, graph it, calculate a particular value, etc.) 7. You may have a procedure that varies from this, but it should contain the same general idea. 8. A stranger should be able to repeat your lab from your procedure. Diagram (optional): Include this section only if it is necessary for clarity. You may hand draw a diagram. Data: Create a data table and list all of your non-calculated values here. If you plan on using a value in your calculation section, it should first appear here. Graph: You must include a labeled graph for your report. Excel is very good at graphing for you. BEST FIT LINES ONLY. Calculations: In your calculation section, you will be using your raw data and your graph to find new information. You must calculate percent error in every lab. This calculation will be in addition to other necessary calculations. Every calculation you do should be described. Below you will see a good and a bad example of each. Neat writing by hand is permitted. Bad Example of Calculations Good Example of Calculations Calculation for Percent Error Conclusion: This is where everything is wrapped up. Here you will remark whether or not you successfully verified the original purpose. There is no penalty for having a lab that does not prove a physics idea. You will be penalized if you make claims that do not match your actual data. If you have a graph, you must connect it to your lab. You will lose points if you do not. You will also comment on your error and its sources here. Saying that there was “experimenter error” is another way to state that you made mistakes that you did not fix; do not expect a good grade if you state this. You should make a connection between the error and your value. In other words, you should verify that the errors that you are claiming would actually result in the value that you got. Do not be vague, be specific about how the error you have changed your lab outcome. The easiest way to end your lab would be to suggest an improvement to reduce the error, or to suggest a new experiment that could support this one. On the lab reports we see, we often see similar problems. These problems often communicate to us more information that you might think. To help you, we have a created a translator for common items in a lab report What we read What we translate this to There was experimenter error We screwed up, but we were too lazy to fix it. I learned a lot from this lab I want to impress you, but I don’t know what I was supposed to learn …this was a small/big experimental error. I think this is a tiny/huge number based on my arbitrary assessment of the numbers. [conclusion that is 2 pages long] I have word diarrhea, and I hate my teacher [lab written completely in pen] I wrote this during lunch, and I just needed something to turn in. Procedure step 4: “collect the data from your setup” I wasn’t paying attention when my partner collected data [any reference to a partner’s lab report] My lab is not as good as theirs Mixing up words: calculation, observation, measurement I don’t know what any of these words mean, I hope you don’t notice I feel, I think, I like I’m not sure, I don’t know, I’m afraid to commit [graph has data points connected dot to dot] I am in 1st grade, and I am sure there is a picture of a giraffe under here. [lab never describes graph] I only did the graph because you said so, my conclusion is probably wrong. [carefully drawn, detailed diagram with color] I deserve a really good grade Lab Checklist Purpose □ Verify ________ by __________ (20 words or less) Procedure □ Written step by step □ These steps can be followed as instructions to repeat your lab Diagram □ Diagram is neatly made □ Color is used to add clarity to diagram Data □ Only non-calculated values are listed in correct units □ Values have descriptive labels Graph □ Labeled axis □ Best fit line □ Equation of best fit line is present Calculations □ Every time you use an equation, it should be labeled why. If it took three equations to get to your answer, I expect three labels. □ Equations are in order from top to bottom Conclusion □ How do your results relate to your conclusion? □ State and explain your percent error in specific terms □ Suggest a specific improvement to the lab that would improve your results ***This is not a completion grade, it is still your responsibility to make sure that your lab is accurate and correct.*** In order for your file to be correctly viewed on the ipad, it needs to be a .pdf file. If you like to make things in Microsoft Word, keep doing it. There are lots of methods to use to convert it into a .pdf file. Zamzar.com is one example.


