Figure 2.15. Indicators of Financial Sector Supervision and
advertisement
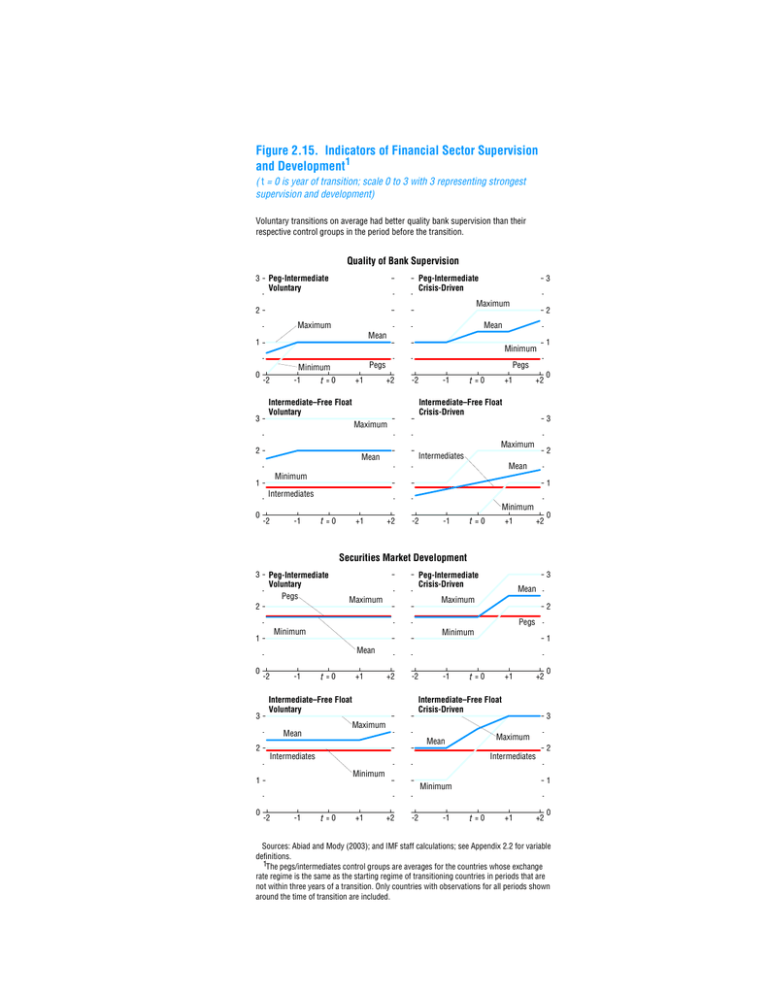
Figure 2.15. Indicators of Financial Sector Supervision and Development1 ( t = 0 is year of transition; scale 0 to 3 with 3 representing strongest supervision and development) Voluntary transitions on average had better quality bank supervision than their respective control groups in the period before the transition. Quality of Bank Supervision 3 Peg-Intermediate Voluntary Maximum 2 Mean 1 3 2 Mean Maximum 0 3 Peg-Intermediate Crisis-Driven Minimum -2 Pegs Minimum tt = 0 -1 +1 Pegs +2 -2 -1 Intermediate–Free Float Voluntary tt = 0 +1 +2 Intermediate–Free Float Crisis-Driven Maximum 2 Intermediates Mean 0 3 Maximum 2 1 Mean Minimum 1 1 Intermediates 0 Minimum -2 -1 tt = 0 +1 +2 -2 -1 tt = 0 +1 +2 0 Securities Market Development 3 Peg-Intermediate Voluntary Pegs 2 3 Peg-Intermediate Crisis-Driven Maximum Mean Maximum 2 Pegs Minimum 1 Minimum 1 Mean 0 3 -2 -1 tt = 0 +1 +2 -2 -1 tt = 0 +1 +2 Intermediate–Free Float Crisis-Driven Intermediate–Free Float Voluntary 0 3 Maximum Mean Maximum Mean 2 2 Intermediates Intermediates Minimum 1 0 1 Minimum -2 -1 tt = 0 +1 +2 -2 -1 tt = 0 +1 +2 0 Sources: Abiad and Mody (2003); and IMF staff calculations; see Appendix 2.2 for variable definitions. 1The pegs/intermediates control groups are averages for the countries whose exchange rate regime is the same as the starting regime of transitioning countries in periods that are not within three years of a transition. Only countries with observations for all periods shown around the time of transition are included.
