Finding the Line of Best Fit With a TI
advertisement
Finding the Line of Best Fit With a TI-83+ Calculator
The table below was taken from Example 1 on page 66 of your textbook. It shows the number of bicycles produced
worldwide for various years between 1965 and 1990. For this example, we will let x = 0 represent 1965.
Year
Number of bicycles
(in millions)
1965
1970
1975
1980
1985
1990
21
36
43
62
79
95
Step 1: Enter the data in your calculator.
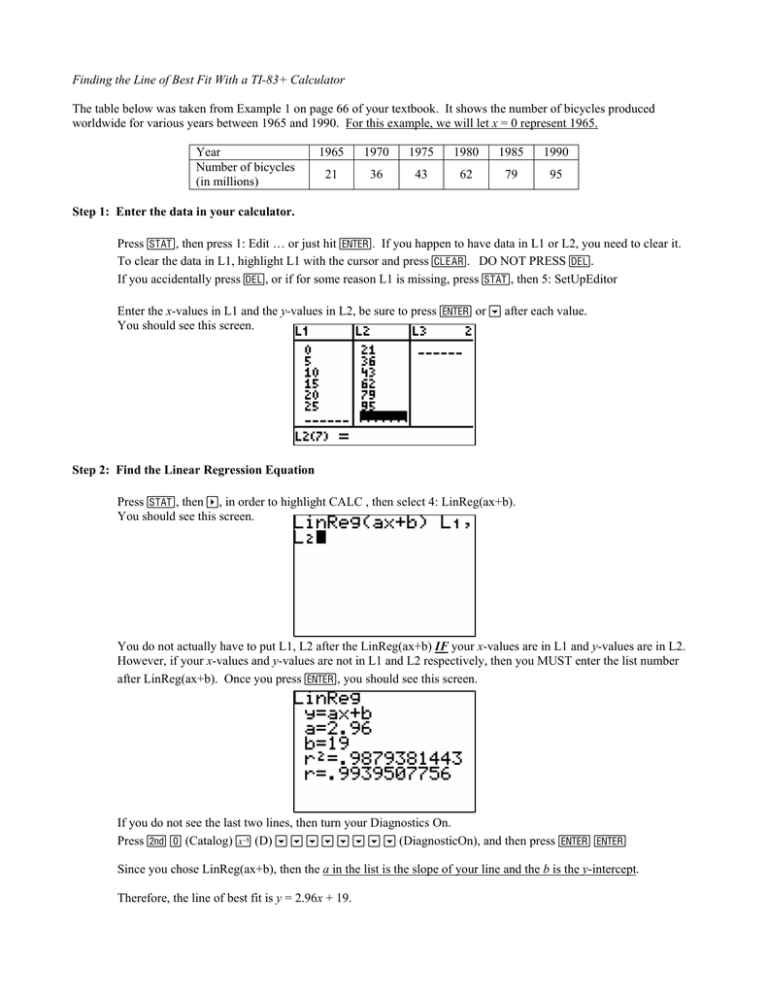
Press …, then press 1: Edit … or just hit Í. If you happen to have data in L1 or L2, you need to clear it.
To clear the data in L1, highlight L1 with the cursor and press ‘. DO NOT PRESS {.
If you accidentally press {, or if for some reason L1 is missing, press …, then 5: SetUpEditor
Enter the x-values in L1 and the y-values in L2, be sure to press Í or † after each value.
You should see this screen.
Step 2: Find the Linear Regression Equation
Press …, then ~, in order to highlight CALC , then select 4: LinReg(ax+b).
You should see this screen.
You do not actually have to put L1, L2 after the LinReg(ax+b) IF your x-values are in L1 and y-values are in L2.
However, if your x-values and y-values are not in L1 and L2 respectively, then you MUST enter the list number
after LinReg(ax+b). Once you press Í, you should see this screen.
If you do not see the last two lines, then turn your Diagnostics On.
Press y Ê (Catalog) œ (D) † † † † † † † † (DiagnosticOn), and then press Í Í
Since you chose LinReg(ax+b), then the a in the list is the slope of your line and the b is the y-intercept.
Therefore, the line of best fit is y = 2.96x + 19.
Step 3: Graphing your data AND the line of best fit
First, graph the data.
Press y o (STAT PLOT). Select 1:Plot1…
You should see this screen.
9
9
9
9
9
Highlight ON, and press Í.
Select the scatter plot type: "
Be sure the Xlist: is L1 (or whatever list your x-values are in),
Be sure the Ylist: is L2 (or whatever list your y-values are in)
The Mark: is a personal preference … each point in your data will be represented by whichever mark you select.
To see the graph, examine your data and create an appropriate viewing window, or press q 9:ZoomStat.
Second, enter the equation of the line.
(In this example, it would be very easy to just enter the equation, but your calculator has stored the regression
equation you found, and you can have the calculator enter it for you).
Press o . From this screen, press . Then select 5:Statistics…
Then press ~ ~ (EQ) and select 1:RegEQ
If you press s you should see the screen below (assuming you haven’t changed the window from before).
