EECS 594 Spring 2008 Lecture 1: O i f Hi h P f Overview of High
advertisement
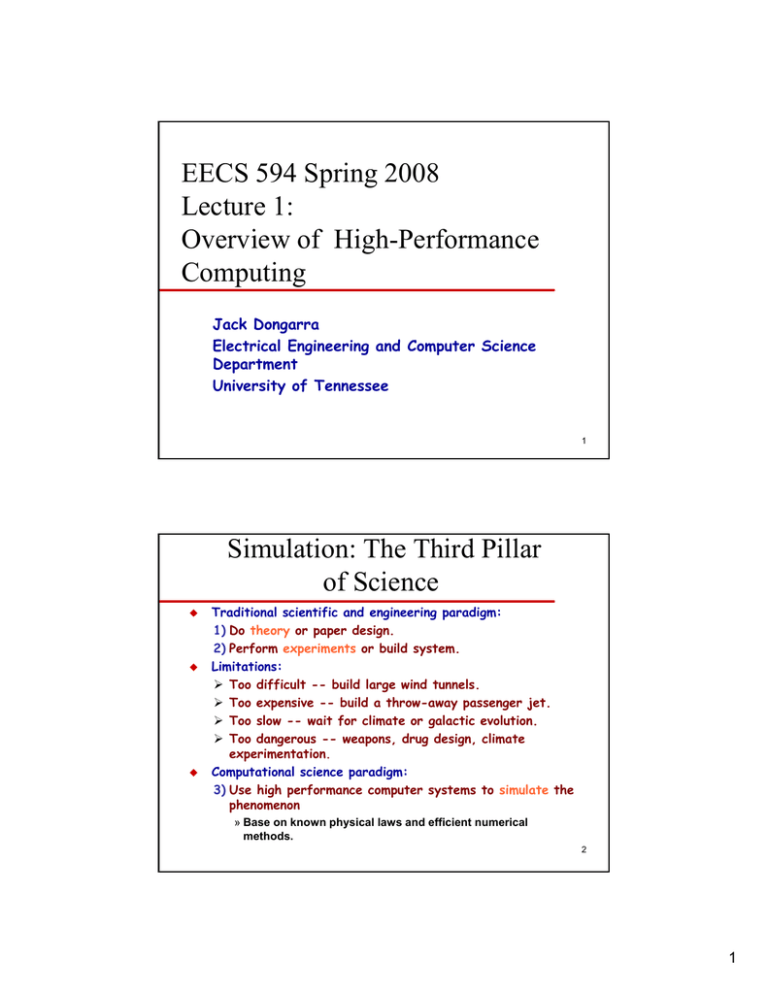
EECS 594 Spring 2008 Lecture 1: O Overview i off High-Performance Hi h P f Computing Jack Dongarra Electrical Engineering and Computer Science Department University of Tennessee 1 Simulation: The Third Pillar of Science Traditional scientific and engineering paradigm: 1) Do theory or paper design. 2) Perform P f m experiments xp im nts or build system. s st m Limitations: ¾ Too difficult -- build large wind tunnels. ¾ Too expensive -- build a throw-away passenger jet. ¾ Too slow -- wait for climate or galactic evolution. ¾ Too dangerous -- weapons, drug design, climate experimentation p . Computational science paradigm: 3) Use high performance computer systems to simulate the phenomenon » Base on known physical laws and efficient numerical methods. 2 1 Computational Science Definition Computational science is a rapidly growing multidisciplinary p y field that uses advanced computing p g capabilities to understand and solve complex problems. Computational science fuses three distinct elements: ¾ numerical and non-numerical algorithms and modeling and simulation software developed to solve science (e.g., biological, physical, and social), engineering, and humanities problems; ¾ advanced system hardware, software, networking, and data management components developed through computer and information science to solve computationally demanding problems; ¾ the computing infrastructure that supports both science and engineering problem solving and developmental computer and3 information science. Relationships Between Computational Science, Computer Science, Mathematics and Applications http://www.nitrd.gov/pitac/ 4 2 The Third Pillar of 21st Century Science 5 Computational science is a rapidly growing multidisciplinary field that uses advanced computing capabilities to understand and solve complex problems. Computational Science enables us to Investigate phenomena where economics or constraints preclude experimentation Evaluate complex models and manage massive data volumes Transform business and engineering practices Computational Science Fuses Three Distinct Elements: 6 3 Computational Science As An Emerging Academic Pursuit 7 Many Programs in Computational Science College for Computing Georgia Tech; NJIT; CMU; … Degrees Rice, Utah, UCSB; … Minor Penn State, U Wisc, SUNY Brockport Certificate C ifi Old Dominion, U of Georgia, Boston U, … Concentration Cornell, Northeastern, Colorado State, … Courses At the University of Tennessee 8 About 2 years ago there was a discussion to create a program in Computational Comp tational Science This program evolved out of a set of meetings and discussions with faculty, students, and administration. Modeled on a similar minor degree program in the Statistics Department on campus. Appeared in the 2007-2008 Graduate Catalog 4 9 Graduate Minor in Computational Science Students in one of the three general areas of p Science;; Computational Applied Mathematics, Computer related, or a Domain Science will become exposed to and better versed in the other two areas that are currently outside their o e area. a ea. “home” A pool of courses which deals with each of the three main areas has been put together by participating department for students to select from. IGMCS: Requirements Applied Mathematics The Minor requires a combination of course work from three disciplines - Computer related, Mathematics/Stat, and a participating Science/Engineering domain (e (e.g., g Chemical Engineering, Chemistry, Physics). At the Masters level a minor in Computational Science will require 9 hours (3 courses) from the pools. At least 6 hours (2 courses) must be taken outside the student’s home area. Students must take at least 3 hours (1 course) from each of the 2 non-home areas At the Doctoral level a minor in computation science will require 15 hours (5 courses) from the pools. At least 9 hours (3 courses) must be taken outside the student’s home area. Students must take at least 3 hours (1 course) from each of the 2 non-home areas Computer Related Domain Sciences 10 5 IGMCS Process for Students 1. 2. 3. 4. A student, with guidance from their faculty advisor, d i l lays out a program off courses Next, discussion with department’s IGMCS liaison Form generated with courses to be taken Form is submitted for approval by the IGMCS Program Committee IGMCS Participating Departments Department IGMCS Liaison Email Biochemistry & Cellular and Molecular Biology Dr. Cynthia Peterson cbpeters@utk.edu Chemical Engineering Dr. David Keffer dkeffer@utk.edu Chemistry Dr. Robert Hinde rhinde@utk.edu Ecology & Evolutionary Biology Dr. Louis Gross gross@tiem.utk.edu Electrical Engineering and Computer Science Dr. Jack Dongarra dongarra@cs.utk.edu Genome Science & Technology Dr Cynthia Peterson Dr. cbpeters@utk edu cbpeters@utk.edu Geography Dr. Bruce Ralston bralston@utk.edu Information Science Dr. Peiling Wang peilingw@utk.edu Mathematics Dr. Chuck Collins ccollins@math.utk.edu Physics Dr. Thomas Papenbrock tpapenbr@utk.edu Statistics Dr. Hamparsum Bozdogan bozdogan@utk.edu 6 Students in Departments Not Participating in the IGMCS Program ´ A student in such a situation can still participate. « Student and advisor should submit to the Chair of the IGMCS Program Committee the courses to be taken. « Requirement is still the same: ² Minor requires a combination of course work from three disciplines - Computer Science related, Mathematics/Stat, and a participating Science/Engineering domain (e.g., Chemical Engineering, g g Chemistry, y Physics). y ) ´ Student’s department should be encouraged to participate in the IGMCS program. ´ Easy to do, needs approved set of courses and a liaison Internship 14 This is optional but strongly encouraged. S d Students in i the h program can fulfill f lfill 3 hhrs. off their h i requirement through an Internship with researchers outside the student’s major. The internship may be taken offsite, e.g. ORNL, or on campus by working with a faculty member in another h d department. Internships must have the approval of the IGMCS Program Committee. 7 15 Some Particularly Challenging Computations Science ¾ ¾ ¾ ¾ ¾ Global climate modeling Astrophysical modeling Biology: genomics; protein folding; drug design Computational Chemistry Computational Material Sciences and Nanosciences ¾ ¾ ¾ ¾ ¾ Crash simulation Semiconductor design Earthquake and structural modeling Computation fluid dynamics (airplane design) Combustion (engine design) Engineering Business ¾ Financial and economic modeling ¾ Transaction processing, web services and search engines Defense ¾ Nuclear weapons -- test by simulations ¾ Cryptography 16 8 The Imperative Of Simulation Experiments prohibited or impossible Experiments dangerous Applied Physics radiation transport supernovae Environment global climate contaminant transport Experiments controversial Biology drug design genomics Experiments difficult to instrument Engineering crash testing aerodynamics Experiments expensive Scientific Lasers & Energy combustion ICF Simulation In these, and many other areas, simulation is an important complement to experiment. 17 HPC Drives Business Competitiveness Reducing design costs through virtual prototyping Reducing physical tests for faster time to market Image courtesy of Pratt & Whitney 18 9 HPC Drives Business Competitiveness Breakthrough insights for manufacturers ¾ Procter & Gamble uses HPC to model production of Pringles® and Pampers® Image courtesy of The Proctor & Gamble Company 19 HPC Drives Business Competitiveness Shortened product development cycles ¾ U.S. entertainment industry must compete with foreign animation studios that have much cheaper wage rates Image courtesy DreamWorks Animation SKG 20 10 HPC Drives Business Competitiveness Complex aerodynamic components for its car designed with the aid of a Supercomputer Using computational fluid dynamics computations to simulate l airflow fl around d parts to aid downforce and aerodynamics and to improve the efficiency of engine 21 and brake cooling. Weather and Economic Loss $10T U.S. economy $1M in loss to evacuate each mile of coastline ¾ 40% is adversely affected by weather and climate ¾ we now over warn by 3X! ¾ average over warning is 200 miles, or $200M per event Improved forecasts LEAD ¾ lives saved and reduced cost ¾ Li Linked k d Environments E i for f Atmospheric Discovery » Oklahoma, Indiana, UCAR, Colorado State, Howard, Alabama, Millersville, NCSA, North Carolina 22 Source: Kelvin Droegemeier, Oklahoma 11 Why Turn to Simulation? When the problem is too . . . ¾ ¾ ¾ ¾ Complex Large / small Expensive Dangerous to do any other way. Taurus_to_Taurus_60per_30deg.mpeg 23 Complex Systems Engineering R&D Team: Grand Challenge Driven Ames Research Center Glenn Research Center Langley Research Center Engineering Team: Operations Driven Johnson Space Center Marshall Space Flight Center Industry Partners Analysis and Visualization Grand Challenges Computation Management - AeroDB - ILab Next Generation Codes & Algorithms OVERFLOW Honorable Mention, NASA Software of Year STS107 Supercomputers, Storage, & Networks INS3D NASA Software of Year Turbopump Analysis CART3D NASA Software of Year STS-107 Modeling Environment (experts and tools) - Compilers - Scaling and Porting - Parallelization Tools 24 Source: Walt Brooks, NASA 12 Economic Impact of HPC Airlines: ¾ System-wide logistics optimization systems on parallel systems. ¾ Savings: approx approx. $100 million per airline per year. year Automotive design: ¾ Major automotive companies use large systems (500+ CPUs) for: » CAD-CAM, crash testing, structural integrity and aerodynamics. » One company has 500+ CPU parallel system. ¾ Savings: approx. $1 billion per company per year. Semiconductor industry: ¾ Semiconductor firms use large systems (500 (500+ CPUs) for » device electronics simulation and logic validation ¾ Savings: approx. $1 billion per company per year. Securities industry: ¾ Savings: approx. $15 billion per year for U.S. home mortgages. 25 Pretty Pictures 26 13 Why Turn to Simulation? Climate / Weather Modeling Data intensive problems (d t minin oil (data-mining, il reservoir i simulation) Problems with large length and time scales (cosmology) 27 Titov’s Tsunami Simulation TITOV Titov’s Tsunami Simulation Global model 28 14 Cost (Economic Loss) to Evacuate 1 Mile of Coastline: $1M We now overwarn by a factor of 3 Average overwarning is 200 miles of coastline, or $200M per event 29 24 Hour Forecast at Fine Grid Spacing This p problem demands a complete, l STABLE BLE environment (hardware and software) ¾ 100 TF to stay a factor of 10 ahead of the weather ¾ Streaming Observations ¾ Massive Storage and Meta Data Query ¾ Fast F t Networking N t ki ¾ Visualization ¾ Data Mining for Feature Detection 30 15 Units of High Performance Computing 1 Mflop/s 1 Megaflop/s 106 Flop/sec 1 Gflop/s 1 Gigaflop/s 109 Flop/sec 1 Tflop/s 1 Teraflop/s 1012 Flop/sec 1 Pflop/s 1 Petaflop/s 1015 Flop/sec 1 MB 1 Megabyte 106 Bytes 1 GB 1 Gigabyte 109 Bytes 1 TB 1 Terabyte 1012 Bytes 1 PB 1 Petabyte 1015 Bytes 31 Let’s say you can print: ¾ 5 columns of 100 numbers each; on both sides of the page = 1000 numbers (Kflop) in one second (1 Kflop/s) 16 Let’s say you can print: ¾ 5 columns of 100 numbers each; on both sides of the page = 1000 numbers (Kflop) per second 1000 pages about 10 cm = 106 numbers (Mflop) 2 reams of paper per second 1 Mflop/s 1 Mflop/s Let’s say you can print: ¾ 5 columns of 100 numbers each; on both sides of the page = 1000 numbers (Kflop) per second ¾ 1000 pages about 10 cm = 106 numbers (Mflop) 2 reams of paper per second 1 Mflop/s 109 numbers (Gflop) = 10000 cm = 100 m stack ¾ Height of Statue of Liberty (printed per second) 1 Gflop/s 1 Gflop/s 17 Let’s say you can print: ¾ 5 columns of 100 numbers each; on both sides of the page = 1000 numbers (Kflop) / second 1 Mflop/s ¾ 1000 pages about 10 cm = 106 numbers b (Mfl (Mflops)) 2 reams of paper/sec 1012 numbers (Tflop) = 100 km stack; Altitude l d achieved h d by b SpaceShipOne to win the prize. 1 Tflop/s (printed per second) 1 Gfl Gflop/s / ¾ 109 numbers (Gflop) = 10000 cm = 100 m stack; Height of Statue of Liberty per sec 1 Tflop/s Let’s say you can print: ¾ 5 columns of 100 numbers each; on both sides of the page = 1000 numbers (Kflop) per second 1 Mflop/s ¾ 1000 pages about 10 cm = 106 numbers b (Mfl (Mflop)) 2 reams of paper / sec 1 Gfl Gflop/s / 1 Tflop/s ¾ 109 numbers (Gflop) = 10000 cm = 100 m stack; Height of Statue of Liberty per second ¾ 1012 numbers (Tflop) = 100 km m stac stack;; SpaceShipOne’s distance to space / sec 1015 1 Pflop/s numbers (Pflop) = 100,000 km stack printed per second 1 Pflop/s (¼ distance to the moon) 18 Let’s say you can print: ¾ 5 columns of 100 numbers each; on both sides of the page = 1000 numbers (Kflop)/sec 1 Mflop/s ¾ 1000 pages about 10 cm = 106 numbers (Mflop); paper/sec p 2 reams of p 1 Gfl Gflop/s / ¾ 109 numbers (Gflop) = 10000 cm = 100 m stack; Height of Statue of Liberty/sec 1 Tflop/s ¾ 1012 numbers (Tflop) = 100 km stack SpaceShipOne’s distance/sec 1 Pflop/s ¾ 1015 numbers (Pflop) = 100,000 km stack ¼ distance to the moon/sec 10 Pflop/s 1016 numbers (10 Pflop) = 1,000,000 km stack / sec 10 Pflop/s (distance to the moon and back and then some) High-Performance Computing Today In the past decade, the world has experienced one of the most exciting periods in computer development. Microprocessors have become smaller, denser, and more powerful. The result is that microprocessor-based supercomputing p p g is rapidly p y becoming g the technology of preference in attacking some of the most important problems of science and engineering. 38 19 Technology Trends: Microprocessor Capacity Gordon Moore (co-founder of Intel) Electronics Magazine, 1965 Number of devices/chip doubles every 18 months 2X transistors/Chip Every 1.5 years Called “Moore’s Law” Microprocessors h Mi have b become smaller, ll denser, and more powerful. Not just processors, bandwidth, storage, etc. 2X memory and processor speed and ½ size, cost, & power every 18 39 months. Moore’s “Law” Something doubles every 18-24 months Something was originally the number of transistors Something is also considered performance Moore’s Law is an exponential ¾ Exponentials can not last forever » However Moore’s Law has held remarkably true for ~30 years BTW: It is really an empiricism rather than a law (not a derogatory comment) 40 20 Today’s processors Some equivalences for the microprocessors i of f today t d ¾ Voltage level » A flashlight (~1 volt) ¾ Current level » An oven (~250 amps) ¾ Power level » A light bulb (~100 watts) ¾ Area » A postage stamp (~1 square inch) 41 Sun Sun’s s Surface Powe er Density (W/cm2) 10,000 10 000 Rocket Nozzle 1,000 Nuclear Reactor 100 Pentium® 10 4004 8086 8085 8008 1 286 Hot Plate 386 486 8080 ‘70 Intel Developer Forum, Spring 2004 - Pat Gelsinger (Pentium at 90 W) ‘80 ‘90 ‘00 ‘10 42 Cube relationship between the cycle time and power. 21 Increasing the number of gates into a tight knot and decreasing the cycle time of the processor Increase Clock Rate & Transistor Density Lower Voltage Cache Core C1 Core C2 Cache C4 Core Heat becoming an unmanageable problem, Intel Processors > 100 Watts C1 C2 C1 C2 C1 C2 C3 C4 C3 C4 We will not see the dramatic increases in clock speeds in the future. Cache C1 C2 C1 C2 C3 C4 C3 C4 C3 C4 However, the number of gates on a chip will continue to increase. 43 24 4 GHz, 1 Core No Free Lunch For Traditional Software (Without highly concurrent software it won’t get any faster!) 12 GHz, 1 Core 2 Cores 4 Cores 6 GHz 1 Core (It just runss twice as fast every 18 months with h no change to the code!) 1 Core 8 Cores 3 GHz 2 Cores 3 GHz, 4 Cores 3 GHz, 8 Cores 3GHz 1 Core Free Lunch For Traditional So oftware Operation ns per second for serial code C3 We have seen increasing number of gates on a chip and increasing clock speed. Cache Additional operations per second if code can take advantage of concurrency 44 22 CPU Desktop Trends 2004-2010 Relative processing power will continue to double every 18 months 256 logical processors per chip in late 2010 300 250 200 150 100 50 0 2004 2005 2006 2007 Hardware Threads Per Chip Cores Per Processor Chip 2008 2009 Year 2010 Power Cost of Frequency • Power ∝ Voltage2 x Frequency (V2F) • Frequency • Power ∝Frequency3 ∝ Voltage 46 23 Power Cost of Frequency • Power ∝ Voltage2 x Frequency (V2F) • Frequency • Power ∝Frequency3 ∝ Voltage 47 What’s Next? All Large Core Mixed Large and Small Core Many Small Cores All Small Core Many FloatingPoint Cores + 3D Stacked Memory SRAM Different Classes of Chips Home Games / Graphics Business Scientific 24 Percentage of peak A rule of thumb that often applies ¾ A contemporary RISC processor, processor for a spectrum of applications, delivers (i.e., sustains) 10% of peak performance There are exceptions to this rule, in both directions Why such low efficiency? There are two primary reasons behind the disappointing percentage of peak ¾ IPC (in)efficiency ¾ Memory (in)efficiency 49 IPC Today the theoretical IPC (instructions per cycle) l ) is i 4 in i mostt contemporary t RISC processors (6 in Itanium) Detailed analysis for a spectrum of applications indicates that the average IPC is 1.2–1.4 We W are leaving l i ~75% 75% of f the th possible ibl performance on the table… 50 25 Why Fast Machines Run Slow Latency ¾ Waiting for access to memory or other parts of the system Overhead ¾ Extra work that has to be done to manage program concurrency and parallel resources the real work you want to perform Starvation ¾ Not enough work to do due to insufficient parallelism or poor load l d balancing b l i among distributed di t ib t d resources Contention ¾ Delays due to fighting over what task gets to use a shared resource next. Network bandwidth is a major constraint. 51 Latency in a Single System Memory e o y Access ccess Timee 300 100 Time (ns) 400 200 10 100 CPU Time 1 Memory to CPU R Ratio 500 Ratio 1000 0 0.1 1997 1999 2001 2003 2006 2009 X-Axis CPU Clock Period (ns) Memory System Access Time Ratio THE WALL 52 26 Memory hierarchy Typical T i l latencies l i for f today’s d ’ technology h l Hierarchy Processor clocks Register L1 cache 1 2-3 L2 cache 6-12 L3 cache 14-40 Near memory 100-300 Far memory 300-900 Remote memory O(103) O(103)-O(104) Message-passing 53 Memory Hierarchy Most programs have a high degree of locality in their accesses ¾ spatial locality: accessing things nearby previous accesses ¾ temporal locality: reusing an item that was previously accessed Memory hierarchy tries to exploit locality processor control datapath registers on-chip Second level cache (SRAM) Main memory Secondary storage (Disk) (DRAM) Tertiary storage (Disk/Tape) cache Speed 1ns 10ns 100ns 10ms 10sec Size B KB MB GB TB 27 Memory bandwidth To provide bandwidth to the processor the bus either needs to be faster or wider Busses are limited to perhaps 400-800 MHz Links are faster ¾ Single-ended 0.5–1 GT/s ¾ Differential: 2.5–5.0 (future) GT/s ¾ Increased I d link li k f frequencies i iincrease error rates requiring coding and redundancy thus increasing power and die size and not helping bandwidth Making things wider requires pin-out (Si real estate) and power 55 ¾ Both power and pin-out are serious issue Processor-DRAM Memory Gap µProc 60%/yr. (2X/1 5yr) (2X/1.5yr) 1000000 CPU 10000 Processor-Memory Performance Gap: (grows 50% / year) DRAM DRAM 9%/yr. (2X/10 yrs) 100 02 00 98 96 94 04 20 20 20 19 19 90 88 86 84 82 92 19 19 19 19 19 19 19 80 1 19 Performance “Moore’s Law” Year 56 28 Sense Amps Sense Amps Memory Stack Memory Stack Sense Amps Sense Amps Decode Processor in Memory (PIM) Node Logic PIM merges logic with memory ¾ Wide ALUs next to the row buffer ¾ Optimized for memory throughput, not ALU utilization PIM while ¾ ¾ ¾ ¾ ¾ Sense Amps Sense Amps Memory y Stack Memory y Stack Sense Amps Sense Amps has the potential of riding Moore's law greatly increasing effective memory bandwidth, providing many more concurrent execution threads, reducing latency, reducing power, and increasing overall system efficiency It may also simplify programming and system 57 design Internet – 4th Revolution in Telecommunications Telephone, Telephone Radio Radio, Television Growth in Internet outstrips the others Exponential growth since 1985 Traffic doubles every 100 days Growth of Internet Hosts * Sept. 1969 - Sept. 2002 250,000,000 200,000,000 100,000,000 50,000,000 58 9/6 9 0 01 /7 1 01 /7 3 01 /7 4 01 /7 6 01 /7 9 08 /8 1 08 /8 3 10 /8 5 11 /8 6 07 /8 8 01 /8 9 10 /8 9 01 /9 1 10 /9 1 04 /9 2 10 /9 2 04 /9 3 10 /9 3 07 /9 4 01 /9 5 01 /9 6 01 /9 7 01 /9 8 01 /9 9 01 /0 1 08 /0 2 No. of Hosts Domain names 150,000,000 Time Period 29 Peer to Peer Computing Peer-to-peer is a style of networking in which a group of computers communicate directly with each h other. h Wireless communication Home computer in the utility room, next to the water heater and furnace. Web tablets BitTorrent ¾ http://en.wikipedia.org/wiki/Bittorrent Imbedded I b dd d computers t iin thi things all tied together. ¾ Books, furniture, milk cartons, etc Smart Appliances ¾ Refrigerator, scale, etc 59 Internet On Everything 60 30 SETI@home: Global Distributed Computing Running on 500,000 PCs, ~1000 CPU Years per Day ¾ 485,821 CPU Years so far Sophisticated h d Data & Signall Processing Analysis Distributes Datasets from Arecibo Radio Telescope Berkeley Open Infrastructure for Network Computing 61 SETI@home Use thousands of Internetconnected PCs to help in the search for extraterrestrial intelligence. intelligence When their computer is idle or being wasted this software will download a 300 kilobyte chunk of data for analysis. Performs about 3 Tflops for each client in 15 hours. The results of this analysis are sent back to the SETI team combined with thousands team, of other participants. Largest distributed computation project in existence ¾ Averaging g g 40 Tflop/s p Today a number of companies trying this for profit. 62 31 Google query attributes ¾ 150M queries/day (2000/second) ¾ 100 countries ¾ 8.0B documents in the index Forward link are referred to in the rows Back links are referred to in the columns Data centers ¾ 100,000 Linux systems in data centers around the world » 15 TFlop/s and 1000 TB total capability » 40-80 1U/2U servers/cabinet » 100 MB Ethernet switches/cabinet with gigabit Ethernet uplink ¾ growth from 4,000 systems (June 2000) » 18M queries then Performance and operation ¾ simple reissue of failed commands to new servers ¾ no performance debugging » problems are not reproducible Eigenvalue problem; Ax = λx n=8x10⁹ (see: MathWorks Cleve’s Corner) The matrix is the transition probability matrix of the Markov chain; Ax = x Source: Monika Henzinger, Google & Cleve Moler Next Generation Web To treat CPU cycles and software like commodities. Enable the coordinated use of geographically distributed resources – in the absence of central control and existing trust relationships. Computing power is produced much like utilities such as power and water are produced for consumers. Users will have access to “power” on demand This is one of our efforts at UT. 64 32 •Why Parallel Computing Desire to solve bigger, more realistic applications li ti problems. bl Fundamental limits are being approached. More cost effective solution 65 Principles of Parallel Computing Parallelism P ll lism Granularity and nd Amdahl Amd hl’ss L Law Locality Load balance Coordination and synchronization Performance P f modeling d li All of these things makes parallel programming even harder than sequential programming. 66 33 “Automatic” Parallelism in Modern Machines Bit llevell parallelism B ll l ¾ within floating point operations, etc. Instruction level parallelism (ILP) ¾ multiple instructions execute per clock cycle Memory system parallelism ¾ overlap of memory operations with computation OS parallelism ¾ multiple jobs run in parallel on commodity SMPs Limits to all of these -- for very high performance, need user to identify, schedule and coordinate parallel tasks 67 Finding Enough Parallelism Suppose only part of an application seems parallel Amdahl’s law ¾ let fs be the fraction of work done sequentially, (1-fs) is fraction parallelizable ¾ N = number of processors Even if the parallel part speeds up perfectly may be limited by the sequential part 68 34 Amdahl’s Law Amdahl’s Law places a strict limit on the speedup that can be realized by y using g multiple p processors. p Two equivalent q expressions for Amdahl’s Law are given below: tN = (fp/N + fs)t1 Effect of multiple processors on run time S = 1/(fs + fp/N) Effect of multiple processors on speedup Where: fs = serial fraction of code fp = parallel fraction of code = 1 - fs N = number of processors 69 Illustration of Amdahl’s Law It takes only a small fraction of serial content in a code to degrade the parallel performance. It is essential to determine the scaling behavior of your code before doing y g production p runs using g large g numbers of processors 250 fp = 1.000 s speedup 200 fp = 0.999 fp = 0.990 150 fp = 0.900 100 50 0 0 50 100 150 Number of processors 200 250 70 35 Overhead of Parallelism Given enough parallel work, this is the biggest barrier to getting desired speedup P Parallelism ll li overheads h d include: i l d ¾ ¾ ¾ ¾ cost of starting a thread or process cost of communicating shared data cost of synchronizing extra (redundant) computation Each of these can be in the range of milliseconds ((=millions of flops) p ) on some systems y Tradeoff: Algorithm needs sufficiently large units of work to run fast in parallel (I.e. large granularity), but not so large that there is not enough parallel work 71 Locality and Parallelism Conventional Storage Proc Hierarchy Cache L2 Cache Proc Cache L2 Cache Proc Cache L2 Cache L3 Cache L3 Cache Memory Memory Memory potential interconnects L3 Cache Large memories are slow, fast memories are small hierarchies are large and fast on average Parallel processors, collectively, have large, fast $ Storage ¾ the slow accesses to “remote” data we call “communication” Algorithm should do most work on local data 36 Load Imbalance Load imbalance is the time that some processors in the system are idle due to ¾ insufficient parallelism (during that phase) ¾ unequal size tasks Examples of the latter ¾ adapting to “interesting parts of a domain” ¾ tree-structured computations ¾ fundamentally unstructured problems Algorithm needs to balance load 73 What is Ahead? Greater instruction level parallelism? Bigger gg caches? Multiple processors per chip? Complete systems on a chip? (Portable Systems) High performance LAN, Interface, and Interconnect 74 37 Directions Move toward shared memory ¾ SMPs and Distributed Shared Memory ¾ Shared address space w/deep memory hierarchy Clustering of shared memory machines for scalability Efficiency y of message passing p and data parallel programming ¾ Helped by standards efforts such as MPI and HPF 75 High Performance Computers ~ 20 years ago ¾ 1x10⁶ Floating Point Ops/sec (Mflop/s) » Scalar based ~ 10 years ago ¾ 1x10⁹ Floating Point Ops/sec (Gflop/s) » Vector & Shared memory computing, bandwidth aware » Block partitioned, latency tolerant ~ Today ¾ 1x10¹² Floating Point Ops/sec (Tflop/s) » Highly parallel, distributed processing, message passing, network based » data decomposition, communication/computation ~ 1 years away ¾ 1x10¹⁵ Floating Point Ops/sec (Pflop/s) » Many more levels MH, combination/grids&HPC » More adaptive, LT and bandwidth aware, fault tolerant, extended precision, attention to SMP nodes 76 38 Top 500 Computers Rate - Listing of the 500 most powerful Comp ters in the World Computers - Yardstick: Rmax from LINPACK MPP TPP performance Ax=b, dense problem Updated twice a year SC‘xy SC xy in the States in November Size Meeting in Germany in June 77 What is a Supercomputer? A supercomputer is a hardware and software system that provides close to the maximum performance p f that can currently y be achieved. Over the last 14 years the range for the Top500 has increased greater than Moore’s Law 1993: ¾ #1 = 59.7 GFlop/s ¾ #500 = 422 MFlop/s MFl / 2007: ¾ #1 = 478 TFlop/s ¾ #500 = 5.9 TFlop/s Why do we need them? Almost all of the technical areas that are important to the well-being of humanity use supercomputing in fundamental and essential ways. Computational fluid dynamics, protein folding, climate modeling, national security, in particular for cryptanalysis and for simulating 78 nuclear weapons to name a few. 39 Architecture/Systems Continuum 100% Commodity processor with custom interconnect Best price/performance (for codes that work well with caches and are latency tolerant) More complex programming model 20% Commod J u n -0 4 J u n -0 3 D e c -0 3 J u n -0 2 D e c -0 2 J u n -0 1 D e c -0 1 J u n -0 0 D e c -0 0 J u n -9 9 D e c -9 9 J u n -9 8 D e c -9 8 J u n -9 7 D e c -9 7 J u n -9 6 0% D e c -9 6 Clusters » Pentium, Itanium, Opteron, Alpha » GigE, Infiniband, Myrinet, Quadrics ¾ ¾ ¾ Hybrid 40% Commodity processor with commodity interconnect ¾ Loosely Coupled J u n -9 5 ¾ SGI Altix » Intel Itanium 2 Cray XT3, XD1 » AMD Opteron Good communication performance Good scalability 60% D e c -9 5 ¾ 80% J u n -9 4 Cray y X1 NEC SX-8 IBM Regatta IBM Blue Gene/L D e c -9 4 ¾ ¾ ¾ ¾ Best processor performance for codes that are not “cache friendly” Good Custom communication performance Simpler programming model Most expensive Custom processor with custom interconnect J u n -9 3 D e c -9 3 Tightly Coupled NEC TX7 IBM eServer Dawning 79 30th Edition: The TOP10 Manufacturer Computer Rmax Installation Site Country Year #Cores 1 IBM Blue Gene/L eServer Blue Gene Dual Core .7 GHz 478 DOE Lawrence Livermore Nat Lab USA 2007 Custom 212,992 2 IBM Bl Blue G Gene/P /P Quad Core .85 GHz 167 Forschungszentrum Juelich Germany 2007 Custom 65,536 SGI Altix ICE 8200 Xeon Quad Core 3 GHz 127 SGI/New Mexico Computing Applications Center USA 2007 Hybrid 14,336 HP Cluster Platform Xeon Dual Core 3 GHz 118 Computational Research Laboratories, TATA SONS India 2007 Commod 14,240 102.8 Government Agency Sweden 2007 Commod 13,728 26,569 3 4 5 6 7 8 9 10 HP Cluster Platform Dual Core 2.66 GHz Opteron Dual Core 2.4 2 4 GHz [TF/s] 102.2 DOE Sandia Nat Lab USA 2007 y Hybrid Cray Opteron Dual Core 2.6 GHz 101.7 DOE Oak Ridge National Lab USA 2006 Hybrid 23,016 IBM eServer Blue Gene/L Dual Core .7 GHz 91.2 IBM Thomas J. Watson Research Center USA 2005 Custom 40,960 Cray Opteron Dual Core 2.6 GHz 85.4 DOE Lawrence Berkeley Nat Lab USA IBM eServer Blue Gene/L Dual Core .7 GHz 82.1 Stony Brook/BNL, NY Center for Computational Sciences USA Cray 2006 Hybrid 2006 Custom 19,320 80 36,864 40 Performance Development 1 Pflop/s 6.96 PF/s IBM BlueGene/L 478 TF/s 100 Tflop/s SUM 10 Tflop/s NEC Earth Simulator 5.9 TF/s N=1 1.17 TF/s IBM ASCI White 1 Tflop/s 6-8 years Intel ASCI Red 59.7 GF/s 100 Gflop/s Fujitsu 'NWT' N=500 10 Gflop/s My Laptop 0.4 GF/s 2007 2006 2005 2004 2003 2002 2001 2000 1999 1998 1997 1996 1995 1994 1993 1 Gflop/s 100 Mflop/s 81 Performance Projection 1 Eflop/s 100 Pflop/s 10 Pflop/s 1 Pflop/s 100 Tflop/s 10 Tflop/s 1 Tflop/s SUM 6-8 years 100 Gflop/s 10 Gflop/s 1 Gflop/s 100 Mflop/s N=1 N=500 8-10 years 1993 1995 1997 1999 2001 2003 2005 2007 2009 2011 2013 2015 30th List / November 2007 www.top500.org page 82 41 Top500 by Usage 287, 57% Industry Research Academic 3, 1% Government 8, 2% Vendor 15, 3% Classified 101, 20% 86, 17% 07 83 Chips Used in Each of the 500 Systems Cray 0% NEC 0% Sun Sparc Sun Sparc 0% 72% Intel 12% IBM 16% AMD Intel EM64T 65% Intel IA‐32 3% HP Alpha 0% HP PA‐RISC 0% AMD x86_64 AMD x86 64 16% IBM Power 12% Intel IA‐64 4% 84 42 Processor Types 30th List / November 2007 www.top500.org page 85 Interconnects / Systems 500 Others Cray Interconnect 400 SP Switch 300 Crossbar 200 Quadrics Infiniband 100 Myrinet 07 2007 2006 2005 2004 2003 2002 2001 2000 1999 1998 1997 1996 1995 1994 1993 0 (121) (18) Gigabit Ethernet(270) N/A 86 GigE + Infiniband + Myrinet 43 Cores per System – November 2007 300 TOP500 Total Cores 1,800,000 1,400,000 1,200,000 200 1,000,000 800,000 150 600,000 400,000 200,000 Number of Systems 250 1,600,000 100 0 50 List Release Date 0 33-64 65-128 129-256 257-512 513-1024 10252048 20494096 4k-8k 8k-16k 16k-32k 32k-64k 64k-128k 87 Top500 Systems November 2007 500 478 Tflop/s 450 7 systems > 100 Tflop/s Rmax (Tflop/s) 400 350 300 250 200 21 systems > 50 Tflop/s 150 100 149 systems > 10 Tflop/s 50 497 465 5.9 Tflop/s 481 433 449 401 417 369 385 337 353 305 321 273 289 241 209 257 Rank 225 1 17 33 49 65 81 97 113 129 145 161 177 193 0 88 44 Computer Classes / Systems 500 400 BG/L Commodity Cluster 300 SMP/ Constellat. 200 MPP SIMD 100 Vector 30th List / November 2007 2007 2006 2005 2004 2003 2002 2001 2000 1999 1998 1997 1996 1995 1994 1993 0 www.top500.org page 89 Countries / Performance (Nov 2007) 60% 2.7% 7.7% 2.8% 3.2% 7.4% 4.2% 90 45 Top500 Conclusions Microprocessor based supercomputers h have brought b ht a major j change h in i accessibility and affordability. MPPs continue to account of more than half of all installed high-performance computers worldwide. 91 Distributed and Parallel Systems Distributed systems heterogeneous Gather (unused) resources Steal cycles System SW manages resources System SW adds value 10% - 20% overhead is OK Resources drive applications Time to completion is not critical Time-shared Massively p parallel systems homogeneous Bounded set of resources Apps grow to consume all cycles Application manages resources System SW gets in the way 5% overhead is maximum Apps drive purchase of equipment Real-time constraints Space-shared 46 Virtual Environments 0.32E-08 0.18E-04 0.50E-02 0.26E-02 0.34E-02 0.79E-03 0.18E-06 0.00E+00 0.19E-05 0.65E-03 0.31E-02 0.38E-02 0.16E-02 0.99E-04 0.00E+00 0 00E+00 0.00E 00 0.17E-04 0.49E-02 0.28E-02 0.00E+00 0.23E-04 0.51E-02 0.27E-02 0.30E-02 0.63E-03 0.34E-08 0.00E+00 0.30E-05 0.14E-02 0.28E-02 0.39E-02 0.14E-02 0.47E-04 0.00E+00 0.00E 0 00E+00 00 0.15E-04 0.45E-02 0.31E-02 0.00E+00 0.23E-04 0.49E-02 0.28E-02 0.27E-02 0.48E-03 0.00E+00 0.00E+00 0.53E-05 0.27E-02 0.27E-02 0.39E-02 0.12E-02 0.16E-04 0.00E+00 0.19E 0 19E-06 06 0.16E-04 0.40E-02 0.33E-02 0.00E+00 0.21E-04 0.44E-02 0.30E-02 0.24E-02 0.35E-03 0.00E+00 0.00E+00 0.96E-05 0.40E-02 0.26E-02 0.37E-02 0.98E-03 0.36E-05 0.00E+00 0 84E-06 0.84E 06 0.10E-03 0.35E-02 0.36E-02 0.38E-06 0.67E-04 0.39E-02 0.33E-02 0.21E-02 0.24E-03 0.00E+00 0.24E-08 0.15E-04 0.49E-02 0.26E-02 0.34E-02 0.81E-03 0.62E-06 0.00E+00 0 16E-05 0.16E 05 0.41E-03 0.31E-02 0.38E-02 0.13E-05 0.38E-03 0.35E-02 0.36E-02 0.18E-02 0.15E-03 0.00E+00 0.00E+00 0.20E-04 0.51E-02 0.27E-02 0.30E-02 0.65E-03 0.41E-07 0.00E+00 0 27E-05 0.27E 05 0.11E-02 0.28E-02 0.39E-02 0.22E-05 0.90E-03 0.31E-02 0.38E-02 0.16E-02 0.80E-04 0.00E+00 0.00E+00 0.20E-04 0.49E-02 0.28E-02 0.27E-02 0.51E-03 0.75E-10 0.00E+00 0 47E-05 0.47E 05 0.23E-02 0.27E-02 0.38E-02 0.33E-05 0.18E-02 0.28E-02 0.39E-02 0.14E-02 0.34E-04 0.00E+00 0.00E+00 0.18E-04 0.45E-02 0.30E-02 0.24E-02 0.38E-03 0.00E+00 0.00E+00 0 82E-05 0.82E 05 0.37E-02 0.26E-02 0.36E-02 0.59E-05 0.30E-02 0.27E-02 0.39E-02 0.11E-02 0.89E-05 0.00E+00 0.29E-06 0.27E-04 0.40E-02 0.33E-02 0.21E-02 0.27E-03 0.00E+00 0.15E-08 0 13E-04 0.13E 04 0.48E-02 0.26E-02 0.33E-02 0.11E-04 0.43E-02 0.26E-02 0.38E-02 0.96E-03 0.16E-05 0.00E+00 0.11E-05 0.23E-03 0.35E-02 0.36E-02 0.18E-02 0.17E-03 0.00E+00 0.00E+00 0 17E-04 0.17E 04 0.51E-02 0.27E-02 0.29E-02 Do they make any sense? 93 47 Performance Improvements for Scientific Computing Problems 10000 1000 100 10 1 1970 1975 1980 1985 1995 Derived from Computational M ethods 10000 Speed-U pF actor Multi-grid 1000 Conjugate Gradient 100 SOR 10 Gaus s -Seidel Spars e GE 1 1970 1975 1980 1985 1990 1995 95 Different Architectures Parallel computing: single systems with many processors working on same problem Distributed computing: many systems loosely coupled by a scheduler to work on related problems Grid Computing: many systems tightly coupled by software, perhaps geographically distributed to work together on single distributed, problems or on related problems 96 48 Types of Parallel Computers The simplest and most useful way to classify l if modern d parallel ll l computers t is i by b their memory model: ¾ shared memory ¾ distributed memory 97 Shared vs. Distributed Memory P P P P BUS P P Shared memory - single address space All processors have access to a space. pool of shared memory. (Ex: SGI Origin, Sun E10000) Memory Distributed memory - each processor has it’s it s own local memory. Must do message passing to exchange data between processors. (Ex: CRAY T3E, IBM SP, clusters) P P P P P P M M M M M M Network 98 49 Shared Memory: UMA vs. NUMA P P P P P P BUS Memory Uniform memory access (UMA): Each processor has uniform access to memory. y Also known as symmetric multiprocessors (Sun E10000) Non-uniform memory access (NUMA): Time for memory access depends on location of data. Local access is faster than non-local access. Easier to scale than SMPs (SGI Origin) P P P P P P P BUS BUS Memory Memory P Network 99 Distributed Memory: MPPs vs. Clusters Processors-memory nodes are connected b some type by t of f interconnect i t t network t k ¾ Massively Parallel Processor (MPP): tightly integrated, single system image. ¾ Cluster: individual computers connected by s/w CPU CPU CPU MEM MEM MEM CPU CPU CPU MEM MEM MEM CPU CPU CPU MEM MEM MEM Interconnect Network 100 50 Processors, Memory, & Networks Both shared and distributed memory systems t h have: 1. processors: now generally commodity RISC processors 2. memory: now generally commodity DRAM 3. network/interconnect: between the processors and memory p y (bus, ( , crossbar,, fat tree, torus, hypercube, etc.) We will now begin to describe these pieces in detail, starting with definitions of terms. 101 Interconnect-Related Terms Latency: How long does it take to start sending di a ""message"? "? Measured M d in i microseconds. (Also in processors: How long does it take to output results of some operations, such as floating point add, divide etc., which are pipelined?) Bandwidth: What data rate can be sustained once the message is started? Measured in Mbytes/sec. 102 51 Interconnect-Related Terms Topology: the manner in which the nodes are connected. t d ¾ Best choice would be a fully connected network (every processor to every other). Unfeasible for cost and scaling reasons. ¾ Instead, processors are arranged in some variation of a grid, torus, or hypercube. 3-d hypercube 2-d mesh 2-d torus 103 Highly Parallel Supercomputing: Where Are We? Performance: ¾ Sustained p performance has dramatically y increased during g the last year. ¾ On most applications, sustained performance per dollar now exceeds that of conventional supercomputers. But... ¾ Conventional systems are still faster on some applications. Languages and compilers: ¾ Standardized, portable, high-level languages such as HPF, PVM and MPI are available. But ... ¾ Initial HPF releases are not very y efficient. ¾ Message passing programming is tedious and hard to debug. ¾ Programming difficulty remains a major obstacle to usage by mainstream scientist. 104 52 Highly Parallel Supercomputing: Where Are We? Operating systems: ¾ Robustness and reliability are improving. improving ¾ New system management tools improve system utilization. But... ¾ Reliability still not as good as conventional systems. I/O subsystems: ¾ New N RAID disks, di k HiPPI iinterfaces, t f etc. t provide id substantially improved I/O performance. But... ¾ I/O remains a bottleneck on some systems. 105 The Importance of Standards Software Writing programs for MPP is hard ... But ... one-off one off efforts if written in a standard language Past lack of parallel programming standards ... ¾ ... has restricted uptake of technology (to "enthusiasts") ¾ ... reduced portability (over a range of current architectures and between future generations) Now standards exist: (PVM, MPI & HPF), which ... ¾ ... allows users & manufacturers to protect software investment ¾ ... encourage growth of a "third third party party" parallel software industry & parallel versions of widely used codes 106 53 The Importance of Standards Hardware Processors ¾ commodity RISC processors Interconnects ¾ high bandwidth, low latency communications protocol ¾ no de-facto standard yet (ATM, Fibre Channel, HPPI, FDDI) Growing demand for total solution: ¾ robust hardware + usable software HPC systems containing all ll the h programming tools l / environments / languages / libraries / applications packages found on desktops 107 The Future of HPC The expense of being different is being replaced by the economics of being the same HPC needs to lose its "special purpose" tag Still has to bring about the promise of scalable general purpose computing ... ... but it is dangerous to ignore this technology Final success when MPP technology is embedded i d in desktop k computing i Yesterday's HPC is today's mainframe is tomorrow's workstation 108 54 Achieving TeraFlops In 1991, 1 Gflop/s 1000 fold increase ¾ Architecture » exploiting parallelism ¾ Processor, communication, memory » Moore’s Law ¾ Algorithm Al ith iimprovements t » block-partitioned algorithms 109 Future: Petaflops ( 1015fl pt ops/s) Today ≈ 1015 flops for our workstations A Pflop for 1 second O a typical workstation computing for 1 year. From an algorithmic standpoint ¾ dynamic redistribution of ¾ ¾ ¾ ¾ concurrency data locality latency & sync floating point accuracy workload ¾ new language and constructs ¾ role l of f numerical i l libraries ¾ algorithm adaptation to hardware failure 110 55 A Petaflops Computer System 1 Pflop/s sustained computing B t Between 10 10,000 000 and d 1 1,000,000 000 000 processors Between 10 TB and 1PB main memory Commensurate I/O bandwidth, mass store, etc. May be feasible and “affordable” by the year 2010 111 56
