Using a Frequency Offset in Order Calculations
advertisement

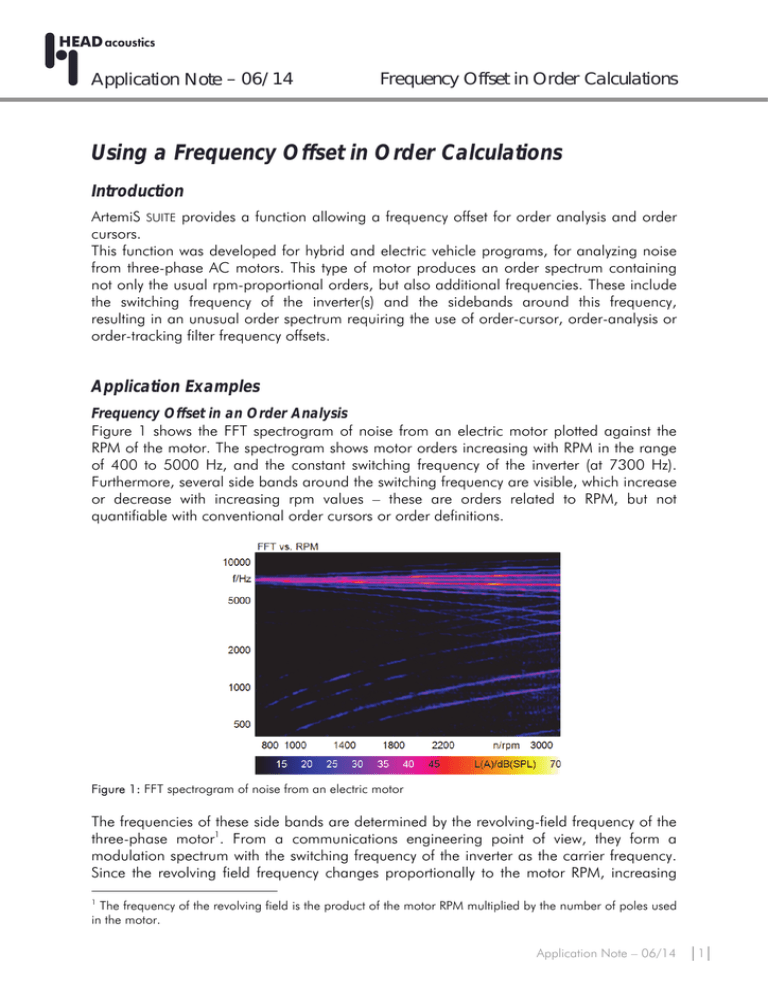
Application Note – 06/14 Frequency Offset in Order Calculations Using a Frequency Offset in Order Calculations Introduction ArtemiS SUITE provides a function allowing a frequency offset for order analysis and order cursors. This function was developed for hybrid and electric vehicle programs, for analyzing noise from three-phase AC motors. This type of motor produces an order spectrum containing not only the usual rpm-proportional orders, but also additional frequencies. These include the switching frequency of the inverter(s) and the sidebands around this frequency, resulting in an unusual order spectrum requiring the use of order-cursor, order-analysis or order-tracking filter frequency offsets. Application Examples Frequency Offset in an Order Analysis Figure 1 shows the FFT spectrogram of noise from an electric motor plotted against the RPM of the motor. The spectrogram shows motor orders increasing with RPM in the range of 400 to 5000 Hz, and the constant switching frequency of the inverter (at 7300 Hz). Furthermore, several side bands around the switching frequency are visible, which increase or decrease with increasing rpm values – these are orders related to RPM, but not quantifiable with conventional order cursors or order definitions. Figure 1: FFT spectrogram of noise from an electric motor The frequencies of these side bands are determined by the revolving-field frequency of the three-phase motor1. From a communications engineering point of view, they form a modulation spectrum with the switching frequency of the inverter as the carrier frequency. Since the revolving field frequency changes proportionally to the motor RPM, increasing 1 The frequency of the revolving field is the product of the motor RPM multiplied by the number of poles used in the motor. Application Note – 06/14 │1│ HEAD acoustics Application Note Frequency Offset in Order Calculations RPM values result in the fan-shaped pattern of increasing and decreasing frequencies as the sidebands diverge both above and below the inverter switching frequency. If a sound containing rpm-dependent orders is analyzed with an order analysis, the curved lines shown in the FFT spectrogram become straight lines defined on an order ordinate. By means of order analysis, an acoustical engineer can easily determine which noise components are caused by the motor revolution and which of these orders are particularly dominant in the spectrum. Figure 2 shows the result of an order analysis of the same signal as in figure 1. The lower part of the diagram shows the constant motor orders, but a group of curved lines also appears. Figure 2: Order spectrum of the signal analyzed in figure 1 The curved lines are the fan-shaped orders (sidebands surrounding the switching frequency of the inverter). They cannot be analyzed meaningfully with a standard order analysis, nor will they align with a standard order cursor. However, by changing a setting in the Properties dialog of the order analysis, it is possible to determine meaningful results for these curves as well. To do so, the switching frequency of the inverter must be entered in the field labeled Frequency Offset. Figure 3 shows the Properties dialog of the analysis with the correct value entered for our example (frequency offset of 7300 Hz). Besides the entry of the frequency offset, the Spectral Range [Order] has been adapted as well. Application Note – 06/14 │2│ HEAD acoustics Application Note Frequency Offset in Order Calculations Figure 3: Properties dialog of the order analysis with frequency offset If the settings mentioned in figure 3 are used, the result shown in figure 4 is achieved. Figure 4: Order analysis result with frequency offset By using the frequency offset in calculating the order spectrum, the curves surrounding the switching frequency of 7300 Hz can be converted to the desired representation and interpreted as orders. Application Note – 06/14 │3│ HEAD acoustics Application Note Frequency Offset in Order Calculations Frequency Offset for the Order Cursor When using the Data Cursor in ArtemiS SUITE, a tool tip is shown for 3D analyses in the diagram. As with the analysis FFT vs. RPM, this tool tip shows the order number as well as another reference line, on which the ratio of the two abscissas remains constant. Based on the cursor position, the order number is determined as the quotient of frequency and revolutions per second. For example, a cursor positioned at 3000 RPM, i.e., 50 revolutions per second, and at a frequency of 2600 Hz results in the 52nd order. Reading the orders in relation to the switching frequencies of the inverter even requires a frequency offset for the order cursor. This can be easily set via function button F6. If the Data Cursor is active in a diagram, click F6 and move the mouse cursor to change the frequency offset of the order line on the second abscissa (Y-axis). Afterwards, click F6 for another time in order to set the frequency offset. Afterwards, the value of the frequency offset is indicated as an additional information at the cursor. The frequency offset can be deleted or reset to 0 by clicking function button F7. Figure 5 shows an activated frequency offset at 7300 Hz in the left diagram and a deactivated frequency offset in the right diagram. Figure 5: Order cursor with (left diagram) and without offset (right diagram) Do you have any questions or remarks? Please write to: imke.hauswirth@head-acoustics.de We look forward to receiving your response! Application Note – 06/14 │4│

