Setting Up the LR circuit Procedure A: Determining L from Time
advertisement

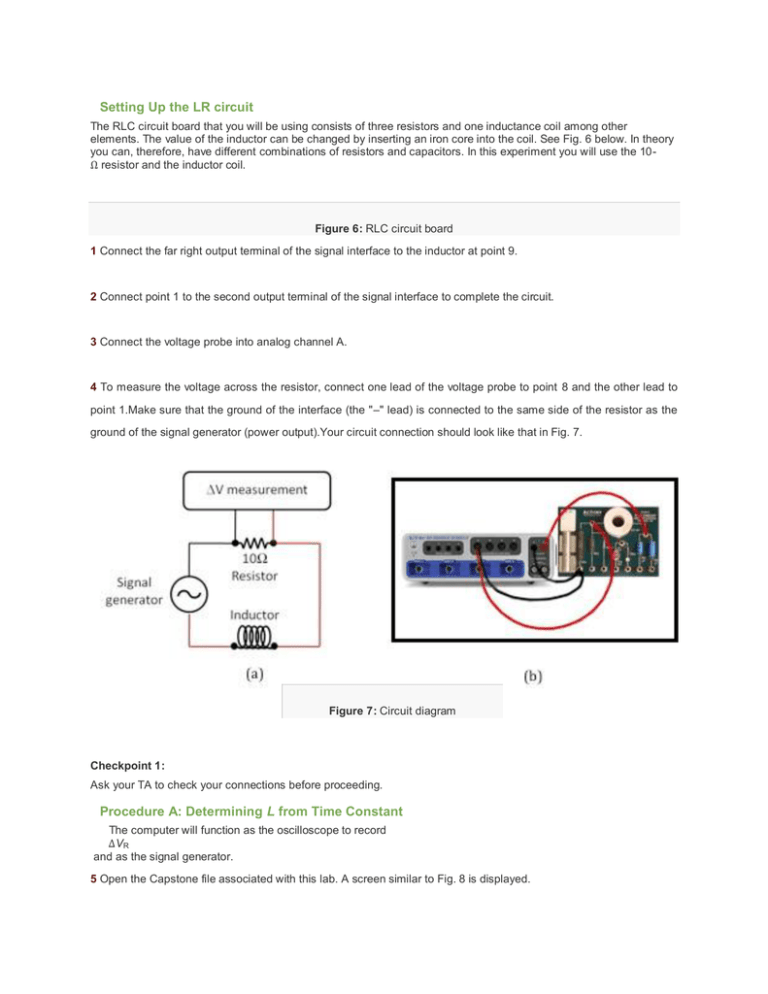
Setting Up the LR circuit The RLC circuit board that you will be using consists of three resistors and one inductance coil among other elements. The value of the inductor can be changed by inserting an iron core into the coil. See Fig. 6 below. In theory you can, therefore, have different combinations of resistors and capacitors. In this experiment you will use the 10Ω resistor and the inductor coil. Figure 6: RLC circuit board 1 Connect the far right output terminal of the signal interface to the inductor at point 9. 2 Connect point 1 to the second output terminal of the signal interface to complete the circuit. 3 Connect the voltage probe into analog channel A. 4 To measure the voltage across the resistor, connect one lead of the voltage probe to point 8 and the other lead to point 1.Make sure that the ground of the interface (the "–" lead) is connected to the same side of the resistor as the ground of the signal generator (power output).Your circuit connection should look like that in Fig. 7. Figure 7: Circuit diagram Checkpoint 1: Ask your TA to check your connections before proceeding. Procedure A: Determining L from Time Constant The computer will function as the oscilloscope to record ΔVR and as the signal generator. 5 Open the Capstone file associated with this lab. A screen similar to Fig. 8 is displayed. Figure 8: Opening screen of LR circuit file 6 The file should open with the signal generator set to produce a positive square wave 7 If not already set, set the voltage to 7V amplitude with the frequency at any value between 120 and 180 Hz and set the voltage offset to 7V. 8 Turn on the signal generator by clicking ON in the signal generator window, and monitor the signal by clicking MONITOR in the main window. There should be a signal trace like that shown in Fig. 9. This will allow you to observe how the voltage on the resistor varies as function of time. Click STOP after a few seconds. The data will remain in the scope window until the next time the START button is clicked. Figure 9 : A sample signal 9 Adjust the voltage (potential difference) and time scales so that about one wavelength is displayed in the scope window, by placing the cursor on the values of each scale and dragging left-right or up-down as appropriate. 10 Select the Show Coordinates button from the buttons above the graph. See fig 10. 11 Using Show Coordinates, determine the starting time (i.e., when the potential difference begins to increase from 0 volts) and record it on the worksheet. 12 Calculate 63% of the maximum potential difference (0.63 ΔVf.) 13Use Show Coordinates to determine the time at which that potential difference occurs. Record this time on the worksheet. Show Coordinates button Figure 10: Show Coordinates 14 From the two time values obtained in steps 11 and 13, determine and record the time required for the signal to go from ΔVR = 0 to ΔVR = 0.63 ΔVf. This is your experimental value for the time constant τ. 15 Use a multimeter to measure the combined resistance of the coil and resistor in series. This is the total resistance of the circuit. See Appendix K.


