Syllabus Course: Psychology 280 (schedule #22542-22545/Sections 5-8); Statistical Methods in Psychology
Syllabus
Course: Psychology 280 (schedule #22542-22545/Sections 5-8); Statistical Methods in Psychology
Course Description: Quantitative methods in psychology for producing, analyzing, and interpreting data. Sampling, basic research designs, describing distributions, correlation, regression, applications of normal probability curve, confidence intervals, and tests of significance. Analysis and interpretation of data using statistical, spreadsheet, and word processing software. Students with credit or concurrent registration in the following lower division statistics courses will be awarded a total of four units for the two (or more) courses: Psychology 280; Administration,
Rehabilitation and Postsecondary Education 201; Biology 215; Civil Engineering 160; Economics 201; Political
Science 201; Sociology 201; Statistics 119 and 250.
Prerequisites: Psychology 101; satisfaction of the Entry-Level Mathematics requirement. Proof of completion of prerequisites required: Copy of ELM score or verification of exemption.
Credit: 4 units
Quarter: Spring, 2014
Time: Tuesday and Thursday, 8:00-9:15 am
Location: COM-207
Instructor: Dale N. Glaser, Ph.D.
Phone: 619-220-0602
Office Hours: By Appointment
E-Mail: glaserconsult@sbcglobal.net
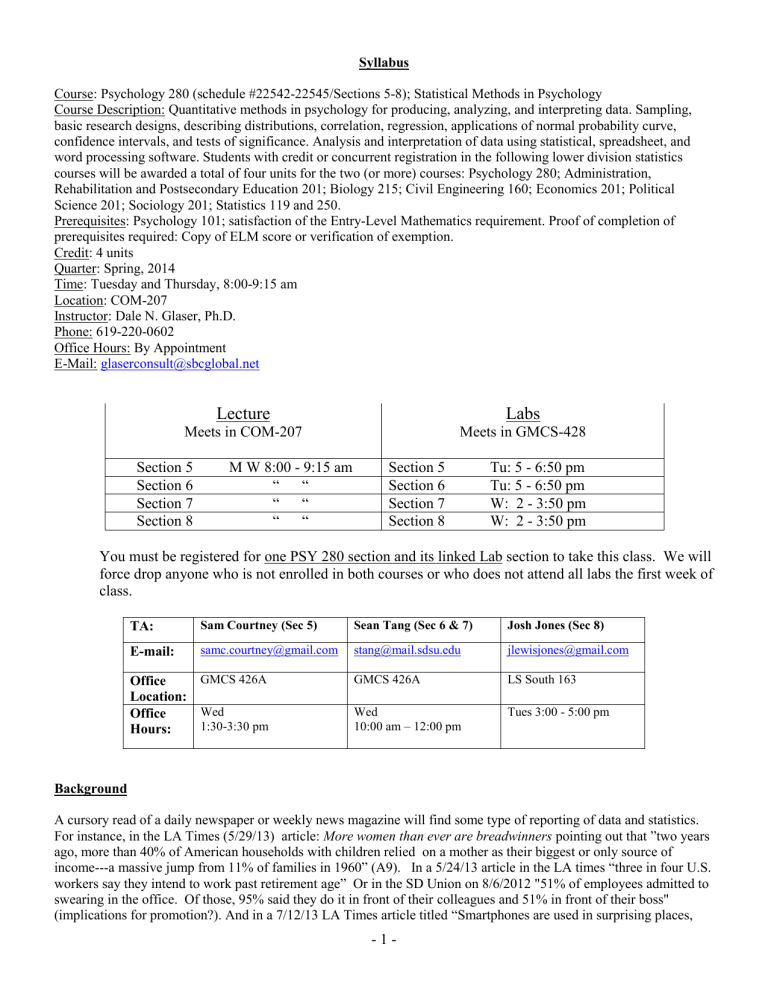
Lecture
Meets in COM-207
Labs
Meets in GMCS-428
Section 5
Section 6
Section 7
Section 8
M W 8:00 - 9:15 am
“ “
“ “
“ “
Section 5
Section 6
Section 7
Section 8
Tu: 5 - 6:50 pm
Tu: 5 - 6:50 pm
W: 2 - 3:50 pm
W: 2 - 3:50 pm
You must be registered for one PSY 280 section and its linked Lab section to take this class.
We will force drop anyone who is not enrolled in both courses or who does not attend all labs the first week of class.
TA: Sam Courtney (Sec 5) Sean Tang (Sec 6 & 7) Josh Jones (Sec 8)
E-mail: samc.courtney@gmail.com
stang@mail.sdsu.edu
Office
Location:
GMCS 426A GMCS 426A jlewisjones@gmail.com
LS South 163
Office Wed Wed Tues 3:00 - 5:00 pm
Hours:
1:30-3:30 pm 10:00 am – 12:00 pm
Background
A cursory read of a daily newspaper or weekly news magazine will find some type of reporting of data and statistics.
For instance, in the LA Times (5/29/13) article: More women than ever are breadwinners pointing out that ”two years ago, more than 40% of American households with children relied on a mother as their biggest or only source of income---a massive jump from 11% of families in 1960” (A9). In a 5/24/13 article in the LA times “three in four U.S. workers say they intend to work past retirement age” Or in the SD Union on 8/6/2012 "51% of employees admitted to swearing in the office. Of those, 95% said they do it in front of their colleagues and 51% in front of their boss"
(implications for promotion?). And in a 7/12/13 LA Times article titled “Smartphones are used in surprising places,
- 1 -
study finds”: “3 in 4 U.S. smartphone users surveyed said they are within five feet of their devices most of the time....more than a third said they use their devices at movie theaters, and 12% said they use them in the shower….but perhaps most unusual is the act that 1 in 11 users said they have used Smartphones________....12% believe their smartphone gets in the way of their relationships”.
From a lead article in Time Magazine titled "The Pursuit of Happiness" (7/2013) the following statistics are enumerated:
1. People who dwell on the past and future are less likely to be happy than people who concentrate on the present
2. 1/4 of single people believe married people have more boring social lives
3. A bad job is better than no job: previously out-of-work people are happier even if a new job has poor pay and hours.
4. 11% of Americans have experienced depression by the age of 18.
5. One-third of Americans say they want to earn significantly more money
6. 1 in 3 stressed Americans copes by shopping
7. Half of couples cohabit before getting married
8. 62% of new mothers are part of the American workforce
9. Teens watch about four hours of TV each day, Adults five: Reality programs like American Idol dominated ratings in 2012
10. Self-improvement products are now a $10 billion industry
11. 23 million American use 4,000 online dating services each month.
12. Homeowners aren’t any happier than renters. They are more likely to experience stress and pack on extra pounds, perhaps as a result.
And in regards to: Does text messaging harm students' writing skills?
[http://www.edutopia.org/poll-textmessaging-writing-skills] partial results as follows:
(1) Yes. I believe students are carrying over the writing habits they pick up through text messaging into school assignments.
54% (1580 votes)
(2) Maybe. Although text messaging may have some impact on how students write, I don't think it's a significant problem.
18% (522 votes)
(3) No. I believe students can write one way to their friends and another way in class. They can keep the two methods separate.
25% (728 votes)
Thus, valuable information can be gleaned from the daily statistics we obtain from the many surveys and research projects conducted; information that can be parlayed into policy and action. However, it is just as important to be a critical consumer of the data, and not fall into the trap of believing every article, blog, or reporter that starts off their commentary with: "research suggests.......". In fact, a 7/27/05 article in the SD Union has the ominous title: " Science
Unbecoming .....misconduct allegations suggest rise in faked data, phony patients and other dubious inventions". A side article reports that "a new set of federal rules is now in effect, placing the onus for identifying, investigating and reporting allegations of scientific misconduct on universities and institutions" (pg. F2). And one of the premier medical journals (i.e., New England Journal of Medicine ) has made it a requirement that all authors who submit articles divulge their funding source. It is inarguable that data plays a integral part in our lives (whether we know it or not!!); therefore, developing skills for interpretation of data is critical.
Course Goals and Objectives
Even though the first statistics course can (and possibly may be!) a daunting experience, especially when one’s selfconfidence in mathematics comes up wanting, many students find that with willful diligence and fortitude, this subject matter is surprisingly intelligible, and even fun (at times!). This introductory course will provide a snapshot into a wide array of commonly-used statistical methodologies: equal emphasis will be placed on understanding both the (1) conceptual and (2) mathematical properties inherent in each of the techniques. Especially of importance is how these are applied in the real world, and examples will be frequently provided in class. The primary goals and objectives are as follows:
- 2 -
Select appropriate statistical tests. Understand which types of circumstances dictate/warrant the use of one technique over another.
Conduct analysis by hand-calculation and/or computer software (e.g., SPSS). Learn how to select proper statistical tool via general statistical software.
Interpret statistical results properly. Show capability in interpreting statistical output.
Understand implications of statistical findings and limits of generalizability/representation of data.
Provide evidence of being able to write up analyses in APA style, including the reporting of results in both narrative and tabular form (and also via graphic displays).
Apply statistical thinking to everyday life (e.g., health and politics) and, as well, ethical issues related to statistical reporting.
Helpful Hints/Platitudes
First of all you will find that the mathematics required for this course is not overwhelming; in fact, basic arithmetic
(i.e., adding, subtracting, deriving square roots, etc.) is the rule here. However, it is essential that you keep up with the logic of the derivations as well as the concepts behind them, which will be discussed in-depth in the classroom. Hence, leading to my second point. Given the cumulative nature of this class, it has been my experience that those who are somewhat ‘random’ (which you will find out later in the course is not synonymous with "haphazard"!!!) in their attendance, will encounter some difficulties if they attempt to learn the material solely through reading/relying on the text. It is the combination of the lecture and examples drawn in class that serve in amplifying and reinforcing the material in the text.
Again, I want to reiterate that the mathematics itself is not unduly complicated. Rather it is the logic that starts to become a bit complex, especially when we get to hypothesis testing. And it has been my experience that those who tend not to attend, and /or anticipate relying on their own resources to learn the material will not achieve an optimal performance in this class.
General etiquette!!: For the consideration of others please turn off and/or do not use any electronic devices (i.e., texting, surfing the web, sending emails, etc.) during class instruction; if you have the compelling reason (i.e., emergency) to do so please excuse yourself from the class. Thank you!
Students with disabilities: ADA/Accommodations: San Diego State University seeks to provide equal access to its programs, services and activities for people with disabilities. If you will need accommodations in the class, reasonable prior notice needs to be given to the Student Disability Services (SDS), 619.594.6473 or online at http://www.sa.sdsu.edu/sds. SDS will work with you and the instructor to make arrangements for accommodations. All written information in this course can be made available in alternative format with prior notification to the SDS.
Academic dishonesty: The Student Code of Conduct is online at http://www.sa.sdsu.edu/srr/conduct1.html.
The academic dishonesty code specifies actions for behaviors such as cheating on tests, plagiarism, and/or inappropriately collaborating with others. I will enforce the code in the course; cheating or other violations will result in appropriate penalties, including a failing grade on the assignment or in the course, and the reporting of that incident to the Office of Student Rights and Responsibilities. Students have the right to appeal such action in accord with the due process.
Course Requirements
1) Given the comprehensive (and cumulative) nature of the curriculum, attendance is strongly encouraged and should be adhered to per school policy.
2) In class exams (3).
Mixture of multiple choice, true/false, and calculation. Material from text, handouts, and lecture. Examinations will be closed book but formulas and statistical tables will be provided during the test.
And do not forget your calculator, but nothing preprogrammed!!. Each exam will be worth 80 points. Please
- 3 -
bring Scantron 882-E (Green) to each test. Note: cell phones will not be allowed in lieu of calculators, so please don't forget to bring your calculator for the tests. You will not be permitted to exchange/share calculators during the exam.
3) Lab Homeworks/Project.
The TA’s will be assigning and grading homework corresponding to the lecture.
Moreover, there will be a Final Project in which you will analyze a data set and write a 5 to 6 page APA style paper elaborating the results section. A detailed description of the project will be distributed later in the term.
(Total lab HW/project adjusted to 80 points).
Other Coursework Notes
Makeup assignments: Makeup assignments are given in very rare circumstances. If you know you will miss an assignment due to official university business or a religious holiday, please contact me as far in advance as possible (at least 2 weeks) to make arrangements. If you are sick or if there is a family emergency, I will require documentation in order to allow you to make up work.
Safety
To be prepared for emergencies, each student is responsible for becoming familiar with the evacuation plan specific to each classroom. The evacuation plan is posted within each classroom and should be examined on the first day of class.
Grading
75% will be accorded for the three exams (80 points/25% for each exam; 240 total points) and 25% (adjusted to 80 points) for the Lab Homeworks/project (15% for homework's and 10% for the final project). Total possible points =
320. Grading will be commensurate with school policy. In the event of an emergency situation, make-up of tests will be granted but only when notification is provided prior to test administration. Extra credit will not be provided in this course!
Course Materials
Textbook :
Gravetter, F.J, & Wallnau, L.B. (2013). Statistics for the Behavioral Sciences (9 th Edition).
Course Website on Blackboard :
Look for PSY270-CX-Fall2013: Combined sections, not individual section links
-
Class lectures will not be available on the web. Handouts (e.g., statistical tables and in-class problems/examples (from t -test on)) and lab assignments will be posted.
Calculator : You will need a scientific calculator. A basic version with a square and square root function is sufficient.
Cost will not be prohibitive (e.g., at Staples can purchase TI-30XA (Texas instruments) for < $12.00).
- 4 -
Day Date Lecture Topic* Skip in Book
RESEARCH METHODS & DESCRIPTIVE STATISTICS
Th 1/23 Ch 1. Introduction to Statistics Real limits (throughout book)
Tu 1/28
Ch. 1 (con't); Ch 2. Frequency
Distributions
Th 1/30 Ch 3. Central Tendency
Tu 2/4 Ch. 3 (con't); Ch 4. Variability
Th 2/6 " "
Stem-and-leaf plots
LOGIC BEHIND INFERENTIAL STATISTICS
Median for continuous variables
"Computational" formulas
(throughout book)
2/11 Ch 5. Z-scores: Location of Scores and
Standardized Distributions
Tu
Th 2/13 Ch. 5 (con't); Ch 6. Probability
(Read all)
(Read all)
Tu 2/18
Ch 7. Probability and Samples: The
Distribution of Sample Means (Read all)
INFERENTIAL STATISTICS FOR TO TEST ONE OR TWO MEANS
Th 2/20 Ch. 7 (con't); Exam Review
Tu 2/25
Exam I (Chapters 1-7) Bring Scantron #
882-E (green)
INFERENTIAL STATISTICS FOR TO TEST ONE OR TWO MEANS
Th
Tu
2/27
3/4
Ch 8. Introduction to Hypothesis Testing Directional 1-tail hypotheses
(throughout book—though will
Ch. 8 Introduction to Hypothesis Testing
(con't) discuss briefly in class)
1-tail tests
Th 3/6
Tu 3/11
Ch. 8 Introduction to Hypothesis Testing
(con't); Ch 9. Introduction to the t-Statistic
Ch. 9 Introduction to the t-Statistic (con't)
+ Confidence Intervals
(Read all)
(Read all)
Th 3/13
Ch. 9 (con't) ; Ch 10. The t-Test for Two
Independent Samples
Tu 3/18
Th 3/27
Ch 10. The t-Test for Two Independent
Samples + Confidence Intervals
Ch 10. The t-Test for Two Independent
Th 3/20
Samples + Confidence Intervals.
Tu 3/25 Ch 11. The t-Test for Related Samples.
Ch 11. The t-Test for Related Samples + exam review
(Read all)
(Read all)
(Read all)
3/31 -
4/4 Spring Break--No Class!!
Tu 4/8
Exam 2 (chapters 8-11) Bring Scantron #
882-E (green)
INFERENTIAL STATISTICS FOR DIFFERENCE BETWEEN SEVERAL MEANS
Th 4/10 Ch 12. Introduction to Analysis of Ignore formulas using T or G,
- 5 -
Variance (ANOVA)
Tu 4/15 " "
Th 4/17 " " skip Scheffe/Tukey post hoc tests
Tu 4/22 Ch 14. Two-Factor Analysis of Variance
Read for content, skip specific formulas/notation.
Th 4/24
Ch 14. Two-Factor Analysis of Variance
(con't)
Tu 4/29 Ch 15. Correlation
INFERENTIAL TESTS FOR PREDICTION
Th thru
Th
5/1 thru
5/8
Integration of:
Ch 15. Correlation (con't)
Ch 16. Introduction to Regression
Exam Review
Ch 15: r as Z section
Ch 16: standard error of estimate; multiple regression and anything after
Final Exam (chapters 12, 14-16) Bring
Scantron # 882-E (green)
(8:00 – 10:00 am)
Tu 5/13
* Though ordering of topics will be as listed above, contingent on progress there may be some overlap of topics across subsequent dates.
- 6 -
