Calculations with Significant Figures Rules for Counting Significant Figures
advertisement
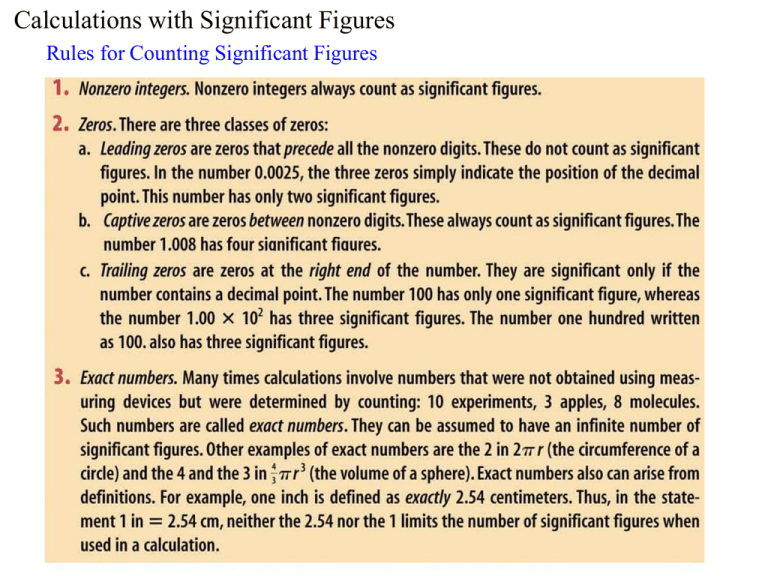
Calculations with Significant Figures Rules for Counting Significant Figures Rules for Significant Figures in Calculations For Multiplication and Division a. Count the number of significant figures in each measurement c. Round the result so it has the same number of significant figures as the measurement with the smallest number of significant figures 4.5 cm x 2 sig figs 0.200 cm 3 sig figs = 0.90 cm2 2 sig figs For Addition and Subtraction a. Result is limited by the number with the smallest number of significant decimal places b. Find last significant figure in each measurement c. Find which one is “left-most” d. Round answer to the same decimal place 450 mL + precise to 10’s place 27.5 mL = 480 mL precise to 0.1’s place precise to 10’s place Rules for Rounding Off 1. If the digit to be removed is: a. < 5, the preceding digit stays the same (1.33 becomes 1.3) b. ≥ 5, the preceding digit is increased by 1 (1.36 becomes 1.4) In a series of calculations, carry the extra digits to the final result and then round off. 1.5 x 2.54 = 3.81 ÷ 2.33 = 1.6351931 Rounds to 1.6 Don’t forget to add place-holding zeros if necessary to keep value the same!! 3.496 (4 figs) rounds to 3.50 (3 sig figs) not 3.5 (2 sig figs) I. Density A. Density is a property of matter representing the mass per unit volume d = m/V 1. Density can be used to identify unknowns or test for composition 2. Density : solids > liquids >>> gases 3. Solids = g/cm3 Liquids = g/ml Gases = g/L 4. Example 25.00 ml of isopropanol = 19.625 g d = ? d = 19.624g / 25.00 ml = 0.7850 g/ml 5. Today: Identify metal based on its density a) Measure mass of unknown metal object on balance b) “Tare” sets the balance to 0.000 g c) Measure mass to 0.001 g d) Volume of object by displacement of water in graduated cylinder Vobject = V(water + object) – V(water only) mass( g ) d volume(cm3 ) Al = 2.70 g/cm3 Brass = 8.40 g/cm3 % Error d ex d known d known Fe = 7.87 g/cm3 Pb = 11.34 g/cm3 x100% II. Graphing A. Circumference = Pi x Diameter (C = pd) (y = mx + b) 1. Measure C and d for several different sizes of beakers 2. diameter (cm) circumference (cm) 10 31 20 63 30 94 40 123 3. Manual Graph a. Required: Title, Name, Date, Axes Labels with units, use most of paper b. Best fit straight line rise y y2 y1 c. Slope 4. B. run x x2 x1 Excel Graph on your own Turn in next week: Data sheets, Excel Graph, Excel spreadsheet Incident: Hot Glass Burn Incident: Hair on Fire Incident: CaO Waste
