Vision 2020 – Impact Assessment
advertisement

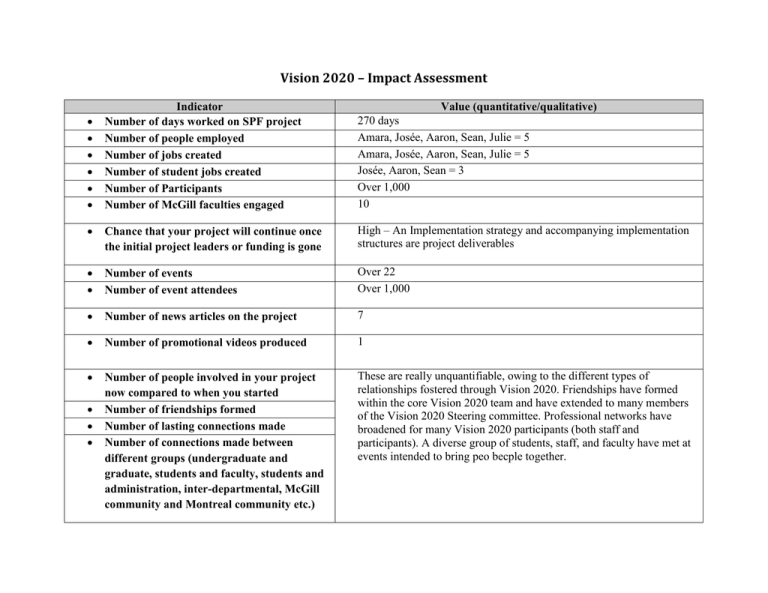
Vision 2020 – Impact Assessment Indicator Number of days worked on SPF project Number of people employed Number of jobs created Number of student jobs created Number of Participants Number of McGill faculties engaged 270 days Amara, Josée, Aaron, Sean, Julie = 5 Amara, Josée, Aaron, Sean, Julie = 5 Josée, Aaron, Sean = 3 Over 1,000 10 Chance that your project will continue once the initial project leaders or funding is gone High – An Implementation strategy and accompanying implementation structures are project deliverables Number of events Number of event attendees Over 22 Over 1,000 Number of news articles on the project 7 Number of promotional videos produced 1 Number of people involved in your project now compared to when you started Number of friendships formed Number of lasting connections made Number of connections made between different groups (undergraduate and graduate, students and faculty, students and administration, inter-departmental, McGill community and Montreal community etc.) These are really unquantifiable, owing to the different types of relationships fostered through Vision 2020. Friendships have formed within the core Vision 2020 team and have extended to many members of the Vision 2020 Steering committee. Professional networks have broadened for many Vision 2020 participants (both staff and participants). A diverse group of students, staff, and faculty have met at events intended to bring peo becple together. Value (quantitative/qualitative) Number of blog posts Average daily blog views 23 25 All-time blog views 6002 Number of twitter followers Number of tweets 283 318 Number of facebook “likes” 147 Number of newsletter subscribers 1084


