T Population Dynamics Name:________________________________ Date:_____________ Period:______
advertisement

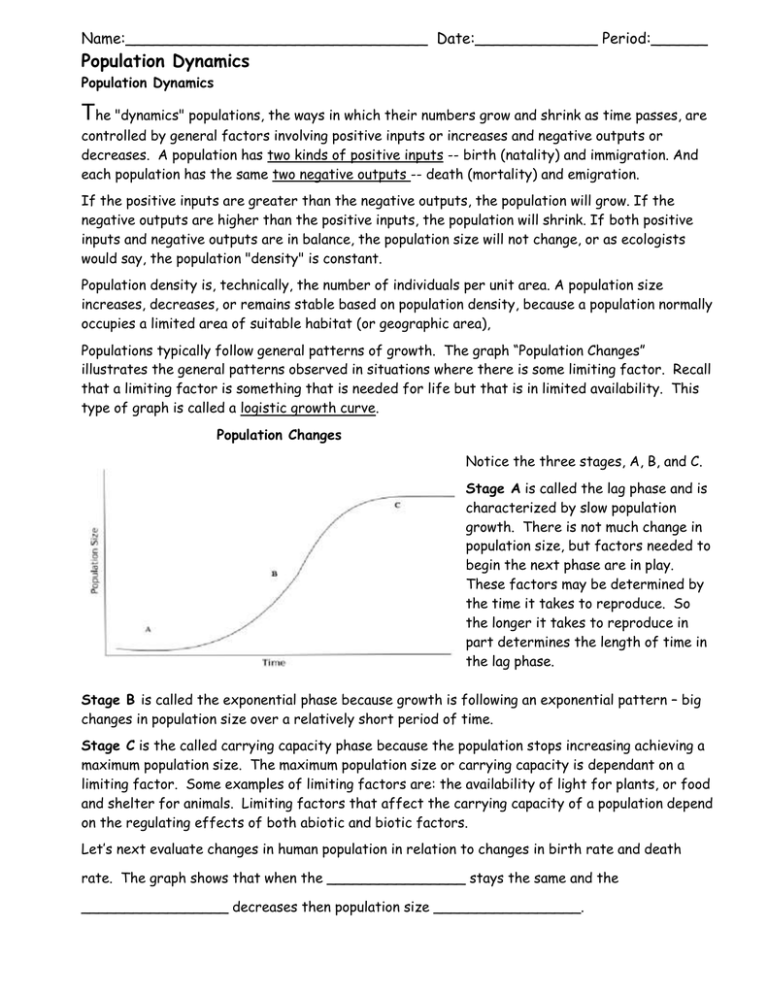
Name:________________________________ Date:_____________ Period:______ Population Dynamics Population Dynamics The "dynamics" populations, the ways in which their numbers grow and shrink as time passes, are controlled by general factors involving positive inputs or increases and negative outputs or decreases. A population has two kinds of positive inputs -- birth (natality) and immigration. And each population has the same two negative outputs -- death (mortality) and emigration. If the positive inputs are greater than the negative outputs, the population will grow. If the negative outputs are higher than the positive inputs, the population will shrink. If both positive inputs and negative outputs are in balance, the population size will not change, or as ecologists would say, the population "density" is constant. Population density is, technically, the number of individuals per unit area. A population size increases, decreases, or remains stable based on population density, because a population normally occupies a limited area of suitable habitat (or geographic area), Populations typically follow general patterns of growth. The graph “Population Changes” illustrates the general patterns observed in situations where there is some limiting factor. Recall that a limiting factor is something that is needed for life but that is in limited availability. This type of graph is called a logistic growth curve. Population Changes Notice the three stages, A, B, and C. Stage A is called the lag phase and is characterized by slow population growth. There is not much change in population size, but factors needed to begin the next phase are in play. These factors may be determined by the time it takes to reproduce. So the longer it takes to reproduce in part determines the length of time in the lag phase. Stage B is called the exponential phase because growth is following an exponential pattern – big changes in population size over a relatively short period of time. Stage C is the called carrying capacity phase because the population stops increasing achieving a maximum population size. The maximum population size or carrying capacity is dependant on a limiting factor. Some examples of limiting factors are: the availability of light for plants, or food and shelter for animals. Limiting factors that affect the carrying capacity of a population depend on the regulating effects of both abiotic and biotic factors. Let’s next evaluate changes in human population in relation to changes in birth rate and death rate. The graph shows that when the ________________ stays the same and the _________________ decreases then population size _________________. http://www.geographyalltheway.com/igcse_geography/population_settlement/population/imagesetc/demographic_transition_detailed.jpg Which stage(s) represent a lag phase_______________________________________ Which stage(s) represent an exponential phase________________________________ Which stage(s) represent a carrying capacity phase____________________________ In the next graph with your neighbor discuss differences between the birth and death rates of German, Italian, and Russian populations over time. Write down your estimate of the population growth over time for these three countries. Be prepared to share your ideas. http://www.usd.edu/~clehmann/pop_prob/russia/demographic_chart.shtml The effects of immigration and emigration are studied more as are markets become more global. http://migration.ucc.ie/images/firstirelandreport/chart4.gif Class Discussion Summary of Irish immigration and emigration The effects of emigration are not generally positive for the countries that experience high rates of emigration. Below is an excerpt from “Give and take across the border - 1 in 7 Mexican workers migrates -- most send money home” by Carolyn Lochhead, Chronicle Washington Bureau, May 21, 2006. http://www.sfgate.com/cgi-bin/article.cgi?file=/c/a/2006/05/21/MNGFQIVNAF1.DTL Migration is profoundly altering Mexico and Central America. Entire rural communities are nearly bereft of working-age men. The town of Tendeparacua, in the Mexican state of Michoacan, had 6,000 residents in 1985, and now has 600, according to news reports. In five Mexican states, the money migrants send home exceeds locally generated income, one study found. Last year, Mexico received a record $20 billion in remittances from migrant workers. That is equal to Mexico's 2004 income from oil exports and dwarfing tourism revenue. Migration has caused significant social disruption in Mexico, though research is scant, said B. Lindsay Lowell, director of policy studies at the Institute for the Study of International Migration at Georgetown University. "We do know that it can break up families, and has done so in many traditional sending areas," he said. "The husband comes to the United States and stays for many years. His wife is on her own with the children. In some cases, the couple comes to the United States and leaves their children behind with relatives." While migration has long served as a safety valve for Mexico (income source), the current wave may also be hindering the political and economic reforms that most agree are needed -- in education, taxes, energy, agriculture and law, where systemic corruption is a serious barrier to growth. "The good news is that a million Mexicans were on the street recently demanding good jobs and good government and justice," Roger Noriega, former assistant secretary of state for Western Hemisphere affairs, told a recent panel at the American Enterprise Institute. "The bad news is they were marching in someone else's country. Every day, thousands of Mexico's most industrious people leave their families behind ... leading many to wonder why Mexico's political class is not capable of creating economic opportunity for its citizens in a land rich in mineral wealth, hydrocarbons, agricultural potential and human capital." Population Graph Analysis. C Population Size Population Size A Describe the following populations Time Time D Population Size Population Size B Time Time Graph A Graph B Graph C Graph D


