LaGuardia Community College Mat 120 Quiz # 2/Homework # 10
advertisement
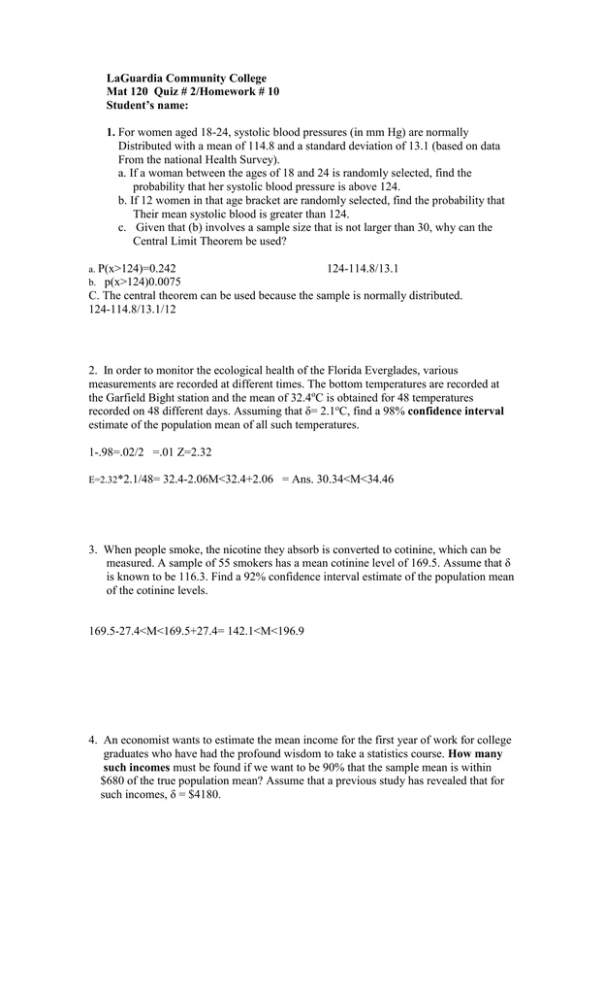
LaGuardia Community College Mat 120 Quiz # 2/Homework # 10 Student’s name: 1. For women aged 18-24, systolic blood pressures (in mm Hg) are normally Distributed with a mean of 114.8 and a standard deviation of 13.1 (based on data From the national Health Survey). a. If a woman between the ages of 18 and 24 is randomly selected, find the probability that her systolic blood pressure is above 124. b. If 12 women in that age bracket are randomly selected, find the probability that Their mean systolic blood is greater than 124. c. Given that (b) involves a sample size that is not larger than 30, why can the Central Limit Theorem be used? a. P(x>124)=0.242 b. p(x>124)0.0075 124-114.8/13.1 C. The central theorem can be used because the sample is normally distributed. 124-114.8/13.1/12 2. In order to monitor the ecological health of the Florida Everglades, various measurements are recorded at different times. The bottom temperatures are recorded at the Garfield Bight station and the mean of 32.4oC is obtained for 48 temperatures recorded on 48 different days. Assuming that δ= 2.1oC, find a 98% confidence interval estimate of the population mean of all such temperatures. 1-.98=.02/2 =.01 Z=2.32 E=2.32*2.1/48= 32.4-2.06M<32.4+2.06 = Ans. 30.34<M<34.46 3. When people smoke, the nicotine they absorb is converted to cotinine, which can be measured. A sample of 55 smokers has a mean cotinine level of 169.5. Assume that δ is known to be 116.3. Find a 92% confidence interval estimate of the population mean of the cotinine levels. 169.5-27.4<M<169.5+27.4= 142.1<M<196.9 4. An economist wants to estimate the mean income for the first year of work for college graduates who have had the profound wisdom to take a statistics course. How many such incomes must be found if we want to be 90% that the sample mean is within $680 of the true population mean? Assume that a previous study has revealed that for such incomes, δ = $4180. 5. Use the given confidence level and the sample data to find the margin of error and the confidence interval for the population mean µ. Assume the population is normally distributed. Elbow to fingertip of men: 99% confidence; n= 28, x = 14.5 in., s = 0.7 in. 14.5-28= Margin of error 13.5 2.771 0.3665 6. The heights of players in a division of high school football teams are normally distributed with mean of 71 inches and a standard deviation of 2.5 inches. Consider the distribution of the sample mean with sample size n = 100. a) Find the mean of the sample means. b) Find the standard deviation of all the sample means c) If 100 students are randomly selected, find the probability that their mean height is greater than 70.5 inches. 0.5080 d) If 100 students are randomly selected, find the probability that their mean height is between 65 and 82 inches. .2648 7. Heights are normally distributed with a mean of 69.0 inches and a standard deviation of 2.8 inches. If the minimum height for men is to be changed so that only the tallest 10 % of men are eligible, what is the new height requirement? .0001 8. Here the number of sales per day that were made by a telemarketer who worked four days before being promoted to a higher post: 7, 13, 19, 9. assume that samples of size 2 are randomly selected with replacement from this population of four values. a) List the 16 different possible samples and find the mean of each of them. b) Find the mean of the sampling distribution. c) Is the mean of the sampling distribution equal to the mean of the population of the four listed values? X 7,13 10 x P(X) p(x) Xp(x) 7,19 13 7 1/16 19 1/16 7 19 7, 9 8 8 2/16 16 7,7 7 9 1/16 9 13,13 13 10 2/16 20 13,7 10 11 2/16 22 13, 19 16 13 3/16 39 13,9 11 14 2/16 28 19,19 19 16 2/16 32 192/16= 12 19,7 13 19,13 16 19,9 14 9,9 9 9,7 8 9,13 11 9,19 14 yes the mean of the sample sampling distribution is equal to the mean of population 12

