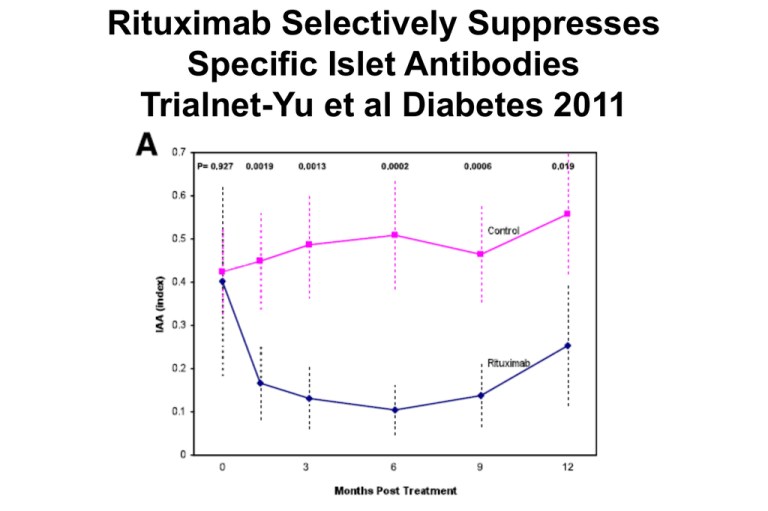
Rituximab Selectively Suppresses Specific Islet Antibodies Trialnet-Yu et al Diabetes 2011
advertisement

Rituximab Selectively Suppresses Specific Islet Antibodies Trialnet-Yu et al Diabetes 2011 Islet autoantibodies can discriminate maturity-onset diabetes of the young (MODY) from Type 1 diabetes. McDonald TJ, Colclough K, Brown R, Shields B, Shepherd M, Bingley P, Williams A, Hattersley AT, Ellard S. Diabet Med 2011 GAD and IA-2 measured: MODY (GCK=227, HNF1A=229, HNF4A=52 patients 5/508 (1%) positive, all GAD only Type 1 (n=98) 82% Positive Dietary Intervention in Infancy and Later Signs of Beta-Cell Autoimmunity Knip et al NEJM 2010 Development of Autoantibodies in the TrialNet Natural History Study Vehik et al Diabetes Care 2011 Genetic Analysis of Adult-Onset Autoimmune Diabetes Joanna M.M. Howson,1 Silke Rosinger,2 Deborah J. Smyth,1 Bernhard O. Boehm,2 the ADBW-END Study Group,* and John A. Todd1 Diabetes 2011 • DR3 associated with GAD antibody positivity of adults with Type 1 diabetes but absence of IA-2 autoantibodies. • DR4 associated with IA-2 positivity and younger age of onset as was DR3/4 heterozygotes. HIGH LEVELS INSULIN AUTOANTIBODIES DAISY STUDY PROGRESSION TO DM FIRST DOT: AGE ANY ANTIBODY APPEARED/ SECOND: DM AGE Steck et al Diabetes Care 2011 Age of Islet Autoantibody Appearance and Mean Levels of Insulin, but Not GAD or IA-2 Autoantibodies, Predict Age of Diagnosis of Type 1 Diabetes Diabetes Autoimmunity Study in the Young LOW LEVELS INSULIN AUTOANTIBODIES DAISY STUDY PROGRESSION TO DM FIRST DOT: AGE ANY ANTIBODY APPEARED/ SECOND: DM AGE Time to DM from age 1st Ab+ MEAN LOG IAA vs Time to DM from age Islet Ab first + 15 R2=.37 P<.0001 10 Steck et al Diabetes Care 2011 5 0 -3.5 -3.0 -2.5 -2.0 -1.5 -1.0 -0.5 log10 Mean Insulin Abs 0.0 Steck… Diabetes Care 2011 GAD65 Levels with Years to Diabetes ICA512 Levels with Years to Diabetes 17.5 Steck… Diabetes Care 2011 17.5 15.0 15.0 12.5 12.5 10.0 10.0 7.5 7.5 5.0 5.0 2.5 2.5 0.0 0.0 -3.5 -3.0 -2.5 -2.0 -1.5 -1.0 -0.5 0.0 -4 Mean GAD65 Levels (Log10) -3 -2 -1 Mean ICA512 Levels (Log10) 0 Steck et al Diabetes Care 2011 Age of Islet Autoantibody Appearance and Mean Levels of Insulin, but Not GAD or IA-2 Autoantibodies, Predict Age of Diagnosis of Type 1 Diabetes Diabetes Autoimmunity Study in the Young Mean Insulin AutoAb levels by INS genotypes mean IAA Levels 0.6 0.5 P=0.027 0.4 0.3 0.2 0.1 0.0 A/A N = 25 Mean= 0.096 SD = 0.159 A/T or T/T 13 0.025 0.045 Steck et al Diabetes Care 2011 Enhancing Prediction Diabetes with ZnT8 Autoantibody Determination • N=88 Children DAISY prospective study + Only one AutoAb (of GAD/IA-2/Insulin) >3 Yrs age and >1 year Follow-up ZnT8 Antibodies measured first Ab+ sample • 14% also ZnT8 Antibody Positive (Thus >=2Ab) ZnT8+ 37% (7/19) Progressed to Diabetes ZnT8- 7% (5/69, P<.003) Progressed Wenzlau et al PNAS 104:17040-17045, 2007 DAISY subjects with only 1 Ab (GAD/IA-2/Insulin) vs + ZnT8 Autoantibodies Wenzlau PNAS 2007 Receiver Operator Characteristics of the ZnT8 antibody assays J.M. Wenzlau, H.W. Davidson, and J.C. Hutton ZnT8 detects autoantibodies in patients who are negative for ICA and gold standard biochemical antibodies. J.M. Wenzlau, H.W. Davidson, and J.C. Hutton Value of 4 antibodies 40 40 30 26 20 13 9 10 0 0 1 1 2 2 3 3 4 Number of Autoantibodies Sera from 223 newly diabetic individuals were assayed for reactivity to insulin, GAD65, and IA-2 ± ZnT8. Nine individuals were negative for insulin, IA-2, and GAD65 but positive for ZnT8 autoantibodies, increasing the percentage of sera positive for at least 1 autoantibody from 94% to 98%. In addition 26 individuals (11.7%) were re-classified from single to multiple autoantibody positivity on the basis of ZnT8 autoreactivity. J.M. Wenzlau, H.W. Davidson, and J.C. Hutton Insulin autoantibodies ICA ? ZnT8 IA-2 (ICA512BDC) GAA mIAA (GAD65) JH4 Autoantibodies 1.1 Levels (index) 0.9 0.7 0.5 0.3 0.1 -0.1 Wenzlau et al PNAS 104:17041-17045, 2007 Zinc Transporter (Znt8) Autoantibodies 1.1 Pos = 63% Levels (index) 0.9 Follow up analysis (Wenzlau et al PNAS 104:17040, 2007) new onset patients 0.7 0.5 0.3 0.1 0.022 -0.1 New Onsets n=340 Controls N=200 Znt8 Islet Autoantigen • ZnT8 cation efflux transporter (Slc30A8) • Approximately 60% of prediabetic and new onset patients express autoantibodies to C-terminus (amino acids 268-369) with fluid phase radioassay • Beta cell specific molecular target • Autoantibodies usually appear post mIAA and GAD65 AA in children followed from birth to type 1 diabetes. Wenzlau et al PNAS 104:17040-17045, 2007 Stages in Development of Type 1 Diabetes GENETICALLY AT RISK BETA CELL MASS MULTIPLE ANTIBODY POSITIVE LOSS OF FIRST PHASE INSULIN RESPONSE GENETIC PREDISPOSITION INSULITIS BETA CELL INJURY “PRE”DIABETES DIABETES TIME J. Skyler NEWLY DIAGNOSED DIABETES Diabetes Classification • Type 1A: Immune Mediated Type 1B: Insulin deficient, no autoantibodies • Type 2: No Autoantibodies, Can initially be treated without insulin • Other Specific forms of Diabetes • Gestational Diabetes BDC-July01 Cytoplasmic ICA kindly provided by the discoverer Franco Bottazzo Inhibition of NOD Diabetes in Absence of Transplacental Antibodies (Ab) Greeley et al, Nature Med 8:399, 2002 80 70 60 50 40 30 20 10 0 IgM Knockout AntiHEL+KO Control DBA/2 Foster Mother No Maternal Ab SCID Mother “Biochemical” Autoantibody Assays • Insulin • Glutamic Acid Decarboxylase • ICA512 (IA-2) BDC Percent 100 ROC of GAD65 (DASP2002-BDC) 100 controls, 50 new onset DM 80 Sensitivity 60 Specificity 40 20 0 -50 450 ROC= Receiver Operator Curve 950 1450 IDS Units 1950 100 ROC: IA-2 Full Length (DASP2002- BDC) 100 Controls, 50 New Onset DM Percent 80 Sensitivity Specificty 60 40 20 0 -50 150 350 IDS Units 550 750 ROC of ICA512bdc (DASP2002-BDC) Percent 100 80 Sensitivity 60 Specificity 40 20 0 -25 125 275 IDS Units 425 575 ROC of mIAA (DASP2002-BDC) Percent 100 80 Sensitivity 60 Specificity 40 20 0 -0.050 0.050 ROC = Receiver Operator Curve 0.150 Index 0.250 ROC of mIAA (DASP2002-BDC) Percent 100 80 Sensitivity 60 Specificity 40 20 0 -0.020 0.000 0.020 Index 0.040 New Onset Children with Diabetes Seen at the Barbara Davis Center P e r c e n t a g e A u t o a n t i b o d y N e g a t i v e b y E t h n i c i t y 8 0 6 0 p < . 0 0 0 1 6 0 3 8 4 0 2 0 7 . 8 0 A f r i c a n A m H i s p a n i cC a u c a s i a n Babu et al. 2,001 BDC Caveats of Autoantibody Testing CAVEAT Assays Vary sensitivity/specificity SUGGESTION Cytoplamsic ICA not used Biochemical AutoAb in Proficiency: spec>=99th Insulin Abs induced by insulin Post "2 weeks" do not injections use insulin Ab assay IAA children; GAD adults Multiple Abs Single Ab Low Risk Multiple Abs Subset No Ab HLA/Insulin/Autoimmunity Abs appear any age Measurement over time Transient Abs possible; Check more than once "Sera" mistakes Similar “rules” Other Autoimmune Disorders • Addison’s Disease(DQ8/DQ2 DRB1*0404) 21hydroxylase Auotantibodies 30/2,100 type 1 pts (1.5%) 5/30 Addison’s first Test (1/400 patients) • Celiac Disease (DQ2 or DQ8) Transglutaminase Autoantibodies 98/847 type 1 pts (12%) 15/20 Biopsies Positive/Estimate 1/20celiac 1/3 DQ2/DQ2 Transglutaminase + 21-Hydroxylase Autoantibodies Levels of autoantibodies 2 1.5 1 0.5 n= 241 Known Healthy Controls Addison's Yu et al, JCEM 84:328-335, 1999 n= 817 n= 13 Negatives Positives Type I Diabetics Figure 2 Percent 21-OH Autoantibody Positive/ Patients with type 1 DM N=208 53 57 55 307 6 5 4 3 2 1 0 DQ2/DQ8 0501/0301:X DQ2/DQ2 DQ8/DQ8 Other Yu et al, JCEM 84:328-335, 1999 BDC Prevalence of Transglutaminase Autoantibodies by HLA-DR Prevalence IDDM Relatives Population 25% 20% 15% 10% 5% HLA-DR 0% DR3+ Bao et al, 13:143-148, 1999 DR3- log FPIR (1+3' insulin) FPIR in pre-diabetic relatives with initial FPIR > 50mU/L 500 50 5 -8 -7 -6 -5 -4 -3 -2 -1 Years prior to diabetes Melbourne Pre-Diabetes Study (Colman PG & Harrison LC) 0 Contrasting Insulin and GAD as Primary Antigen type 1 DM KNOCKOUT/Alter GENE SEQUENCE ANTI-SENSE INSULIN GAD Prevent NOD DM N/A GAD65 no effect Decrease DM 2/6 Ab LEVEL correlate rate YES to DM High Affinity Ab-NOD YES NO High Affinity Ab-Man YES YES Early T-Cell NOD YES YES Protection with Ag-NOD YES YES Induction Diabetes TCR YES NO T-Cell Response Man YES YES Not Detected BDC 125I-Insulin T1/2 in vivo in man Anti-Insulin Abs: Insulin Turnover 10000 1000 Not Insulin Rx 100 Not Resistant Insulin Resistant 10 1 0.1 1 10 100 1000 10000 mU/ml Maximum Binding Titer Davidson and DeBra, Immunologic Insulin Resistance: Diabetes 27:307-18, 1978 10000 Anti-insulin autoantibodies (nU/ml) 1000 100 10 1 5 10 15 20 Age (years) 25 30 Insulin Autoantibodies Versus Age of Diabetes Onset Diabetes Care 11:736-739, 1988 35 IAA assay H i g h T h r o u g h p u t A n t i I n s u l i n A u t o a n t i b o d y A s s a y 1 . m i x ( 1 2 5 ) I i n s u l i n a n d s e r a S e r a ( 1 2 5 ) I n s u l i n o 2 . I n c u b a t e 7 2 h o u r s a t 4 C P r o t e i n A / G S e p h a r o s e 3 . A d d P r o t e i n A / G S e p h a r o s e t o r e a c t i o n m i x i n a 9 6 w e l lf i l t r a t i o n p l a t e A g A b m i x t u r e V a c u u m o 4 . I n c u b a t e f o r 4 5 m i n a t 4 C 5 . W a s h e a c h w e l lu s i n g t h e v a c u u m o p e r a t e d 9 6 w e l lp l a t e w a s h e r 6 . C o u n t r a d i o a c t i v i t y w i t h 9 6 w e l lp l a t e b e t a c o u n t e r B e t a C o u n t e r INSULIN BDC Insulin Autoantibodies: A Chain L13 BDC Insulin Receptor Binding Region PERCENT 100 90 80 70 60 50 40 30 20 10 0 Affin>10(9) Multipe Abs f/u Diabetes Proinsulin High Risk "False Positive" Mature high-affinity immune responses to (pro)insulin anticipate the autoimmune cascade that leads to type 1 diabetes. Achenbach et al, J.Clin Invest 2004, 114:589 96-Well Plate Micro-IAA Assay for Mouse Serum 100 Micro-IAA Assay (index) 10 1 0.1 0.01 0.001 0.0001 0 1 NOD Yu et al. PNAS: 97:1701-1706, 2,000 2 3 Balb/c 4 5 6 C57/Bl6 BDC 96-Well filtration Plate IAA Radioassay 100 Levels of IAA (index) 10 1 0.1 0.01 0.001 0.0001 Normal Controls Yu et al. PNAS: 97:1701-1706, 2,000 New Onset Patients RC Curve of mIAA Sensitivity (%) 90 80 0.006 0.009 70 0.010 0.008 60 50 40 30 20 10 0 0 0 0.001 0.004 0.005 0.003 10 20 Specificity (1-%) Yu et al. PNAS: 97:1701-1706, 2,000 30 The Levels of mIAA in Prediabetic Children Relatives (n= 3) General Population (n= 2) 10 10 1 DM DM 0.1 0.01 0.001 0.0001 Level of mIAA (index) Level of mIAA (index) DM DM 1 0.1 DM 0.01 0.001 0.0001 0 2 4 Age (years) Yu et al. PNAS: 97:1701-1706, 2,000 0 2 4 Age (years) BDC Anti-insulin Autoantibodies 10 IAA (+) at 8wks 1 IAA (+) at 20wks or later 0.1 0.01 0.001 0.0001 0 4 8 12 16 20 24 28 32 36 40 glucose (mg%) Age (weeks) 600 500 IAA (+) at 8wks 400 IAA (+) at 20wks or later 300 200 100 0 0 4 8 12 16 20 24 28 32 36 40 Age Diabetes Onset Age (weeks) IAA(+) 35 > IAA(-) 30 25 20 15 10 5 0 4 8 12 16 20 24 28 32 36 Weeks of first positive of IAA positive Yu et al. PNAS: 97:1701-1706, 2,000 Percent Not DM Age Insulin NOD Mice Divided by IAA Appearance 100 Autoantibodies first Appeared P<.001 80 8 wks + 60 12,16 + 40 >=20+ or - 20 0 0 10 20 30 Age (w eeks) 40 BDC Rapid induction of Insulin Autoantibodies by Insulin B:9-23 peptide immunization in Normal BALB/c mice IAA (index) 10 1 0.1 0.01 0.001 3 4 5 6 7 8 9 10 11 12 13 weeks B:9-23+ IFA B:9-23+ IFA BDC Dynamic Changes GAD65 Autoantibody epitope Specificities… Schlosser et al, Diabetologia 48:922, 2005 • Analysis competition with recombinant monoclonals to GAD of prediabetic children. -- No difference epitopes initial sample -- High risk children emergence of antibodies to conformational N-terminus and middle region --For high risk but not low risk children binding to Nterminus and middle region increases Domains/Splice Variants ICA512 1 LUMINAL DOMAIN CYTOPLASMIC 576 979 PTP domain 577-600 Mini:930-978 Transmembrane 1 ICA512 979 256 979 ICA512bdc 556 630 Alternative Splice minus 557 to 629 (73 aa) BDC F1 ICA512 (IA2) Fragments Positivity 1 577 256 DM Transient 600 556 979 630 (100%) (100%) 605 ICA512ic 1 979 TM 256 90% 30% 0% 0% 37% 30% 54% 10% 760 760 761 F2B 10% 979 ICA512bdc F2A 98% 928 Modified from Miao et al. J. Autoimmunity 2002 with F1= Full Length IA-2 BDC IA-2 mRNA Expression 370 bp, Regular mRNA 151 bp, Alternatively Spliced mRNA Thymus fetal tissues (21-27 weeks), adult pancreas. Pugliese et al. BDC GAD and ICA512 Abs: 71,000 DPT Screening Samples 6 Percent Positive 5 4 GAD ICA512 1 Ab+ 2 Ab+ 3 2 1 0 Sibling n=27,128 Yu et al, NYAS 2002 Offspring n=17063 Parent n=15,561 BDC Percent Positive GAD and ICA512 Abs: 71,000 DPT Screening Samples 9 8 7 6 5 4 3 2 1 0 GAD ICA512 1 Ab+ 2 Ab+ 2 DM Parents n=105 Yu et al, NYAS 2002 One DM Parent n=16,901 BDC Percent Positive GAD and ICA512 Abs: 71,000 DPT Screening Samples 5 4.5 4 3.5 3 2.5 2 1.5 1 0.5 0 GAD ICA512 1 Ab+ 2 Ab+ 1st Degree Relative n=59,752 Yu et al, NYAS 2002 2nd Degree Relative n=9,856 BDC DPT-1: Percent GAD or ICA512+ High % Eligible or Diabetic Biochemical Ab+ of Cytoplasmic ICA+ Relatives 80 70 60 50 40 30 20 10 0 E le b i lig P en r a al r e t El le b i ig al r O A IC at e ep R g. e N ti c e ab i D 2+ 0 06 Yu et al, Diabetes 50,2001 Percent of 71,148 DPT Screening Samples GAD/ICA512/Cytoplasmic ICA+ 2.5 2.2 95%-/-/- 2 1.7 1.5 1 GAD65 only ICA512 only GAD and ICA512 Neg. GAD/512 0.8 0.78 0.5 0.15 0.25 0.19 0 ICA + ICA Negative Yu et al. Diabetes 50: 2001 DAISY Study Population General population families screened = 21,000 patients enrolled = 108 Families with type 1 diabetes Diabetic Non-diabetic infants high risk - DR3/3 96 15 545 moderate risk - DR3/x, 3/4 607 230 553 low risk 650 415 1,353 660 1,206 All Rewers et al DAISY Interviews and Clinical Interviews: B 3m 6m 9m diet infections immunizations allergies stress 1y 15m 2y 3y Visits Clinical Visits: blood sample for GAA, IAA, ICA512, ICA DNA throat and rectal swabs Rewers et al saliva sample BDC The Age at Autoantibody Conversion in DAISY AAb+ Siblings 12 10 Age AAb+ (yrs) 8 6 4 2 Robles et al, 0 A1, A2 + A1, A2 - Clin Immunol 102:217, 2002 Percent BabyDiab (Offspring) Autoantibody Positive at age 5 years HLA and Insulin Gene VNTR 30 25 20 INS I/I INS I/III III/III 15 10 5 0 DR3-4 DQ8 4-4 DQ8 Other HLA Walter et al, Diabetologia (2003) 46:712-720 Progression to Diabetes vs Number of Autoantibodies (GAD, ICA512, Insulin) Percent not Diabetic 100 80 3 Abs 2 Abs 1 Ab 60 40 20 0 0 2.5 5 7.5 10 12.5 15 Years of Follow-up 3 Ab n = 41 2 Abs n = 44 1 Abs n = 93 17 27 23 8 15 14 Verge et al, Diabetes 45:926-933, 1996 1 4 10 2 6 1 4 BDC Lack of Progression to DM of ICA+ 0602+ Relatives Percent Not Diabetic 0602+ 0602- 100 75 50 25 0 0 Pugliese et a. 2 4 6 8 10 12 Years of Follow up BDC Islet Autoantibodies are rapid responders to stimulus - rises in GADA immediately post-islet tx 100 1 10 0.1 1 0 20 40 60 80 200 400 600 800 1000 10 1 100 0.1 10 1 0 20 40 60 80 200 400 600 800 Days post islet transplant 10 1 100 0.1 10 1 1000 10 100 1 0.1 10 C-peptide (ng/ml) 1000 Patient D x Patient C GADA IA2A IA x Antibody units 10 x x 1000 C-peptide (ng/ml) Patient B Patient A 1 0 20 40 60 80 100 120 140 160 0 300 600 900 1200 Days post islet transplant 1800 2400 Bosi et al, Diabetes, 2001


