School Improvement Plan Iredell-Statesville Schools
advertisement

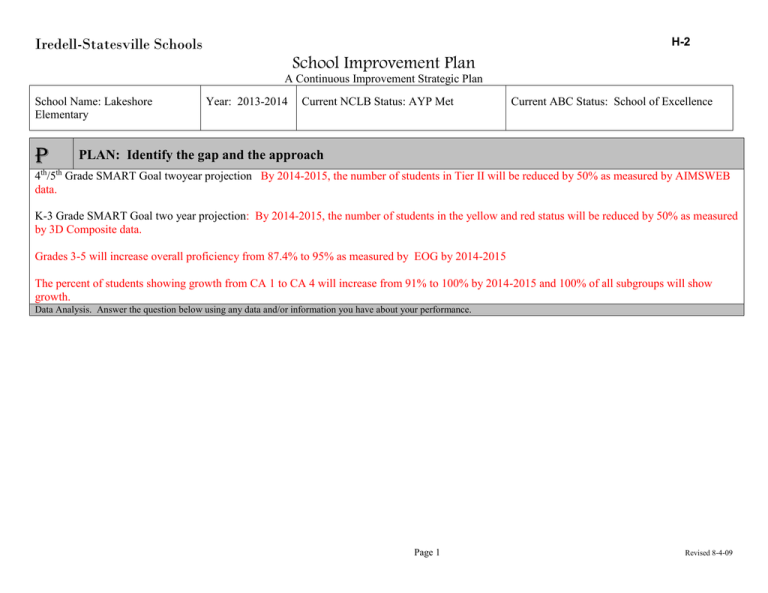
Iredell-Statesville Schools H-2 School Improvement Plan A Continuous Improvement Strategic Plan School Name: Lakeshore Elementary P Year: 2013-2014 Current NCLB Status: AYP Met Current ABC Status: School of Excellence PLAN: Identify the gap and the approach 4th/5th Grade SMART Goal twoyear projection By 2014-2015, the number of students in Tier II will be reduced by 50% as measured by AIMSWEB data. K-3 Grade SMART Goal two year projection: By 2014-2015, the number of students in the yellow and red status will be reduced by 50% as measured by 3D Composite data. Grades 3-5 will increase overall proficiency from 87.4% to 95% as measured by EOG by 2014-2015 The percent of students showing growth from CA 1 to CA 4 will increase from 91% to 100% by 2014-2015 and 100% of all subgroups will show growth. Data Analysis. Answer the question below using any data and/or information you have about your performance. Page 1 Revised 8-4-09 Iredell-Statesville Schools H-2 School Improvement Plan A Continuous Improvement Strategic Plan Kinder LNF 2012-2013 Kinder LSF 2012-2013 Page 2 Revised 8-4-09 Iredell-Statesville Schools H-2 School Improvement Plan A Continuous Improvement Strategic Plan Kinder PSF 2012-2013 Kinder NSF 2012-2013 Page 3 Revised 8-4-09 Iredell-Statesville Schools H-2 School Improvement Plan A Continuous Improvement Strategic Plan First Grade Fluency 2012-2013 Second Grade Fluency 2012-2013 Page 4 Revised 8-4-09 Iredell-Statesville Schools H-2 School Improvement Plan A Continuous Improvement Strategic Plan Third Grade Fluency 2012-2013 Fourth Grade Fluency 2012-2013 Page 5 Revised 8-4-09 Iredell-Statesville Schools H-2 School Improvement Plan A Continuous Improvement Strategic Plan Fifth Grade Fluency 2012-2013 Page 6 Revised 8-4-09 Iredell-Statesville Schools H-2 School Improvement Plan A Continuous Improvement Strategic Plan 2012-2013 Reading Fidelity Data 100 90 80 70 60 50 40 30 20 10 0 Aug-Oct Nov-Dec tim e o. ef at .. d fie rti ce r co e ob ... db ee k ac . r.. en flu c.. d ith ed nd i te s / w r F a a a d t w g e n m b s il op er co kin t iv up sig bu pr ch r c d e r o p o e o r o n t a t g ea w rr gd n du ed es ng up in ts Co o i r n n l r i o / k , a t g u r u y d li g or en el Ad n ve gd ow w ka rv m e o n s io i l ir n s r e i t k T t p Ta s ab In cu en c, ing ap nt ail rv ifi d e g v Oc c e a t e in la ud In Re Sp St Us Al on m ... Dec-Feb Mar-Apr Apr.-May Reading Success and Corrective Reading Fidelity 2012-2013 Cycle 3 Reading Success: Total Walks-5 Total Possible Look Fors-65 Total Yes Responses- 61=93.8% yes Total No Responses-None Total Items Marked as N/A-4-6.2% Page 7 Revised 8-4-09 Iredell-Statesville Schools H-2 School Improvement Plan A Continuous Improvement Strategic Plan Corrective Reading: Total Walks:11 Total Possible Look Fors=297 Average Fidelity Rating for all walks: 2.68 (on a scale of 1=Appropriate, 2=Somewhat Appropriate, 3=Appropriate) Not Observed Marked 27 Times=9% Cycle 4 Reading Success: Total Walks-5 Total Possible Look Fors-65 Total Yes Responses- 65=100%yes Total No Responses-None Total Items Marked as N/A-None Corrective Reading: Total Walks:5 Total Possible Look Fors=135 Average Fidelity Rating for all walks: 2.73 (on a scale of 1=Appropriate, 2=Somewhat Appropriate, 3=Appropriate) Not Observed Marked 6 times 4.44% Page 8 Revised 8-4-09 Iredell-Statesville Schools H-2 School Improvement Plan A Continuous Improvement Strategic Plan 2012-2013 CA Subgroup Data 100 90 80 70 60 50 40 CA 1 30 20 CA 3 CA 2 CA4 Grades K-5 20112012 Overall 93 C3 88 AI G D M ale Fe m ale M ul ti SW LE P ED % of Individual Students Showing CA Growth 2012-2013 First Second Third Fourth K C2 80 Hi AA sp an ic Am Asi er an . In di an W hit e 10 0 C4 91 C2 89 C3 96 C4 100 C2 76 C3 85 C4 91 C2 69 Page 9 C3 78 C4 C2 84 71 C3 80 Fifth C4 95 C2 66 C3 80 C4 84 Grades K-5 2012-2013 Overall 91 Revised 8-4-09 Iredell-Statesville Schools H-2 School Improvement Plan A Continuous Improvement Strategic Plan 2012-2013 EOG Data Unavailable until October 2013 % Proficient EOG Lakeshore Elementary Percent Proficient 100.00% 80.00% 60.00% Series1 40.00% 20.00% 0.00% 2006- 2007- 2008- 2009- 2010- 2011- Series1 93.20 81.40 84.70 83.20 81.40 87.40 Year Data Analysis. Answer the data analysis questions. 1. What is contributing to your success in this area and how do you know? Strengths: K-triangles for reading Letter Naming Fluency 92% green Spring, Nonsense word fluency 94% 2. What opportunities for improvement do you notice? 3rd, 4th, 5th Grade Fluency OFI’S-3rd , 4th, 5th grade reading fluency spring all Page 10 3. What seems to be the root cause of the problem and how do you know? Grade 3-5 need support for how to focus more on building strong fluency during core instruction, All grades use Core Revised 8-4-09 Iredell-Statesville Schools H-2 School Improvement Plan First Grade Fluency 85% in green, Second grade fluency 81% green, Fifth grade fluency shows steady trend of improvement, Strong reading fluency data in K-2 indicates a reduction for students that will be needing additional support in grades 3-5 Fidelity data indicates that look fors are occurring more than 90% of the time in most areas. A Continuous Improvement Strategic Plan below 80% Fidelity data shows need for focus on specific and corrective feedback. Make sure that all available adults are working with students. Need to increase fluency in the core as supported by number of students in yellow/red AIMS. Reading Success and Corrective Reading Implementation is improving with ongoing support. Reading Success at 100% in Cycle 4 Phonics Survey to drill down to literacy gap and provide aligned intervention. Identify student early and provide intervention at tier 1 level before student needs to move to tier 2. Focus on grades k-3 moving to Reading 3D-taking the place of AIMS reading. Monitor interventions with fidelity through frequent progress monitoring…if not working must move to something new. Be creative with scheduling so that students are able to receive interventions that they need. Use AIMS and 3D data to support enrichment as well for students needing to move beyond. Look for ways to increase student engagement during Core instruction. Target SMART Goal (One year projection based on the answer to question 2 above.): By 2013-2014 Lakeshore Students in grades 3-5 will increase proficiency from 87.4 to 91% as measured by the End of Grade Reading Test. By 20132014, the percent of students showing growth in grades K-5 will increase from 91% to 97% as measured by CA. We will reduce students in tier 2 interventions by 50% (from 85 students to 43 students) as measured by AIMs/3D data. 100% of students in enrichment will demonstrate growth as measured by AIMs/3D data. Page 11 Revised 8-4-09 Iredell-Statesville Schools H-2 School Improvement Plan A Continuous Improvement Strategic Plan What will you do during cycle 1 (Identify key approach or strategy you will implement during cycle 1 to move toward achieving your target goal.)? Implement RtI Diamond Model –with clearly defined core that provides for increased student engagement and is supported by Balanced Literacy, Foundations of Reading, Common Core and a clearly defined tier II that incorporates a targeted intervention block and enrichment block. D Step # #1 #2 #3 #4 #5 #6 DO: Develop and Implement Deployment Plan Cycle 1 List the specific steps your team will complete during the first cycle. Person(s) responsible for completion of the step. Measure/Indicator (How will you know if the step is completed correctly?) Start Date Continue Training of Common Core, Reading Foundations, Balanced Literacy Continue to implement Balanced Literacy, Common Core and strategies of Reading foundations during core instruction Ongoing RtI coaching from core team (RtI pilot) Offer refresher training and new training for new staff for AIMS web screener and progress monitoring. Administer universal screener, AIMS/3D , to all students and identify students that will be targeted during core instruction and tier II intervention block. Continue implementation of core instruction that incorporates Reading Foundations, Common Core, Blevins/Reavis LES Core Chart 8/26/13 6/11/14 Hinson/Semanko ERD 8/26/13 6/11/14 RtI trainers Semanko Agendas/Minutes Agenda from training 8/26/13 8/26/13 6/11/14 10/1/13 Semanko Classroom Teachers Semanko List or at-risk students 8/26/13 10/1/13 Lesson Plans 8/26/13 6/11/14 Page 12 End Date Revised 8-4-09 Iredell-Statesville Schools H-2 School Improvement Plan #7 #8a #8b #9 A Continuous Improvement Strategic Plan Balanced Literacy with focus on fluency in the core. Train the systematic intervention/enrichment Hinson PD Agenda/Minutes and sign 8/26/13 programs Reading Mastery, Corrective and Reading in Success. Letterland Training k-2 Hinson CEU’s/TNL 8/26/13 Implement Hinson Teir II Pirate Time Lesson 8/26/13 Reading Mastery K-2 and other intervention programs Plans 10/1/13 10/1/13 10/1/13 Grade level teams with support of RtI team develop a plan for tier II intervention/enrichment to deliver program and other supports. Schedule 4 data days, one each quarter, to review AIMS data and other data points to determine next steps. Ongoing support through PLC’s and ERD for the RtI plan, Reading Foundations, Balanced Literacy, and Common Core Revisit, Improve, Implement Fidelity tools to be used for monitoring tier II remediation and enrichment block based on agreed non-negotiables. Revisit and administer Universal CA to all students Analyze Universal CA to identify students for enrichment block Coughlin/Dagenh art /Hill Completed tier 2 chart 8/26/13 10/1/13 Hinson Data Agenda/Minutes 8/26/13 6/11/13 Semanko Agenda/Minutes 8/26/13 6/11/13 Blevins/Reavis Fidelity tool 8/26/13 10/1/13 Blevins/Reavis Blevins/Reavis 8/26/13 8/26/13 10/1/13 10/1/13 #15 Utilize 2012-2013 marathon data and final data review to identify list of at-risk students Semanko 8/26/13 10/1/13 #16 #17 Teachers review list of at-risk students Identify Students that will be targeted during tier II remediation/interventions/enrichment are identified Enhancement and TAs are assigned to specific grade levels for extra support during the remediation/enrichment block District differentiation and intervention specialist Semanko Semanko Universal CFA in each grade Marathon Data and list of students for enrichment black Marathon Data and list of students for remediation block Revised at-risk list List of at-risk students 8/26/13 8/26/13 10/1/13 10/1/13 Hinson Pirate Time plan 6/11/13 8/25/13 Hinson Completed schedule 8/25/13 6/11/14 #10 #11 #12 #13 #14 #18 #19 Page 13 Revised 8-4-09 Iredell-Statesville Schools H-2 School Improvement Plan #20 #21 #22 #23 #24 #25 #26 #27 #28 #29 A Continuous Improvement Strategic Plan works with enrichment block teachers through ERD support and goal teams. Referesher Training on tiered paperwork to be used RtI coordinator Agenda from training with at risk students. Begin tiered paperwork for all students receiving tier Blevins/Reavis Tiered Tracking Sheet II remediation or intervention and need progress monitoring. Implement tier II intervention and enrichment block Hinson Fidelity Data following the established blueprint. Implement fidelity tool for intervention and Hinson Fidelity Data enrichment block. Probe remediation group and record results on line Blevins/Reavis Assessment results graph, attached to tiered paperwork Maintain and update tiered paperwork for Reavis/Blevins Tiered Tracking Sheet remediation students Administer/Analyze AIMS WEB/Reading 3D Hinson AIMS WEB results/report Screening benchmarks Administer CA (EOG at EOY) according to school Hinson/Semanko/ Marathon Data testing schedule Regrut Analyze CA data to determine strength of core and Blevins/Reavis % of students at each tier students identified in each tier beginning, middle, and data end of year. Analyze data and determine next steps Blevins/Reavis Data questions Page 14 8/26/13 10/1/13 8/26/13 10/1/13 8/26/13 10/1/13 8/26/13 10/1/13 8/26/13 6/11/14 8/26/13 6/11/13 8/26/13 6/11/13 5/1/14 6/1/14 8/26/13 6/11/14 8/26/13 6/11/14 Revised 8-4-09 Iredell-Statesville Schools H-2 School Improvement Plan A Continuous Improvement Strategic Plan What resources/budget needs do you have for the first cycle? -purchase intervention/enrichment program-Reading Mastery -materials for FCRR interventions to increase fluency If you identified budget needs, what budget code will you use to meet the budget needs for this cycle? -instructional money -I3 Grant If funding is not available, identify the steps from the implementation plan that will address the funding gap. -PTO support, community/partnership support What professional development, if any, will be offered in cycle 1 to support the staff in implementing the approach? -Reading Foundations To Select Teachers -AIMS web Refresher -Reading 3D Refresher -Balanced Literacy Continued -Common Core ERD Support and PLC Support Page 15 Revised 8-4-09 Iredell-Statesville Schools H-2 School Improvement Plan List the information or measures the team will use to determine if the approach was implemented/completed? (Completion Data) A Continuous Improvement Strategic Plan B. List the information or measures the team will use to determine if the approach wasn’t implemented correctly? (Fidelity of implementation.) C. List the information or measures the team will use to determine what worked and what didn’t work? (Impact data) CA, EOG Data, AIMS web Data Fidelity tool for intervention/enrichment block Progress Monitoring Tool Tiered Paperwork S Study – Analysis of data after implementing an approach At the end of cycle 1, answer the following questions based on the data collected from the identified measures in boxes A, B, and C above: 1. What worked and how do you 2. What didn’t work and how do you 3. Do you need any additional assistance as you look at your know? know? results and start planning for Cycle 2? ___Yes _x__No Reflect on the answers in box 1 and 2 above for cycle 1 and check which option best describes what you will do in your plan for cycle 2 (double click the box and select “check” to check the box)? Target goal has been met and is changed to a new target goal. Target goal not met so we will continue current plan. We will make Target goal not met but current plan is effective so we will improvements to the plan based on what didn’t work as identified in #2 above. continue current plan and repeat it for the next cycle. Target goal not met and information indicates that we need to abandon the current plan and identify a new approach. A Act – Revise or continue with implementation plan based on data analysis. 4. What is your next step for cycle 2 (Identify key approach or strategy Step # Cycle 2 List the specific steps your team will complete during the second cycle. Person(s) responsible for completion of the step. Measure/Indicator (How will you know if the step is completed correctly?) Start Date End Date #1 Page 16 Revised 8-4-09 Iredell-Statesville Schools H-2 School Improvement Plan A Continuous Improvement Strategic Plan #2 #3 #4 #5 #6 #7 7a. 7b. 7c. #8 #9 #10 #11 #12 #13 #14 #15 #16 #17 #18 #19 #20 Page 17 Revised 8-4-09 Iredell-Statesville Schools H-2 School Improvement Plan A Continuous Improvement Strategic Plan What resources/budget needs do you have for cycle 2 If you identified budget needs, what budget code will you use to meet the budget needs for this cycle? If funding is not available, list the steps from the implementation plan that will address the funding gap. What professional development, if any, will be offered in cycle 2 to support the staff in implementing the approach?, Determine the measures/data that will be used to determine the effectiveness of the Cycle 2 approach by answering the following questions A. List the information or measures the team will use to determine if the approach was implemented/completed? (Completion Data) S B. List the information or measures the team will use to determine if the approach wasn’t implemented correctly? (Fidelity of implementation.) C. List the information or measures the team will use to determine what worked and what didn’t work? (Impact Data) Study – Analysis of data after implementing an approach At the end of cycle 2, answer the following questions based on the data collected from the identified measures in boxes A, B, and C above: 3. What worked and how do you know? 4. What didn’t work and how do you know? 3. Do you need any additional assistance as you look at your results and start planning for Cycle 2? Reflect on the data analysis for the year so far and check the option below that best describes your direction for the 2012-13 SIP? A Act – Continue with the Target Goal or revise the Target Goal for next year. Overall goal has been met and School Improvement Plan focus will change for next year. Or… Target goal has been met and is changed to a new target goal. Target goal not met but current plan is effective so we will continue current plan and repeat it for the 2013-14 SIP to take our work to sustaining.. Page 18 Revised 8-4-09 Iredell-Statesville Schools H-2 School Improvement Plan A Continuous Improvement Strategic Plan .Target goal not met, so we will continue current plan for 2013-14. We will make improvements to the plan based on what didn’t work through this year. Begin planning your 2014-2015 SIP on a new template. Your DRAFT plan is due on _______. Page 19 Revised 8-4-09


