A Maximum Likelihood Approach to Multiple Fundamental Frequency Estimation
advertisement

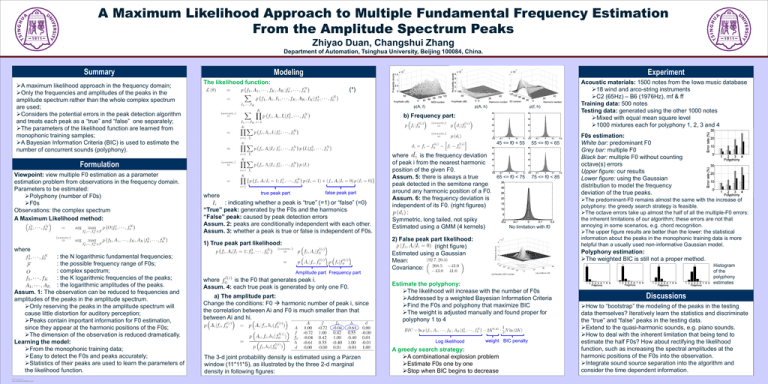
A Maximum Likelihood Approach to Multiple Fundamental Frequency Estimation From the Amplitude Spectrum Peaks Zhiyao Duan, Changshui Zhang Department of Automation, Tsinghua University, Beijing 100084, China. Summary A maximum likelihood approach in the frequency domain; Only the frequencies and amplitudes of the peaks in the amplitude spectrum rather than the whole complex spectrum are used; Considers the potential errors in the peak detection algorithm and treats each peak as a “true” and “false” one separately; The parameters of the likelihood function are learned from monophonic training samples; A Bayesian Information Criteria (BIC) is used to estimate the number of concurrent sounds (polyphony). Modeling Experiment The likelihood function: (*) p(A, f) where true peak part false peak part : indicating whether a peak is “true” (=1) or “false” (=0) “True” peak: generated by the F0s and the harmonics “False” peak: caused by peak detection errors Assum. 2: peaks are conditionally independent with each other. Assum. 3: whether a peak is true or false is independent of F0s. where TEMPLATE DESIGN © 2007 www.PosterPresentations.com where is the frequency deviation of peak i from the nearest harmonic position of the given F0. Assum. 5: there is always a true peak detected in the semitone range around any harmonic position of a F0. Assum. 6: the frequency deviation is independent of its F0. (right figures) : Symmetric, long tailed, not spiky Estimated using a GMM (4 kernels) 45 <= f0 < 55 55 <= f0 < 65 65 <= f0 < 75 75 <= f0 < 85 No limitation with f0 2) False peak part likelihood: (right figure) Estimated using a Gaussian Mean: Covariance: 1) True peak part likelihood: : the N logarithmic fundamental frequencies; : the possible frequency range of F0s; : complex spectrum; : the K logarithmic frequencies of the peaks; : the logarithmic amplitudes of the peaks. Assum. 1: The observation can be reduced to frequencies and amplitudes of the peaks in the amplitude spectrum. Only reserving the peaks in the amplitude spectrum will cause little distortion for auditory perception; Peaks contain important information for F0 estimation, since they appear at the harmonic positions of the F0s; The dimension of the observation is reduced dramatically. Learning the model: From the monophonic training data; Easy to detect the F0s and peaks accurately; Statistics of their peaks are used to learn the parameters of the likelihood function. p(f, h) b) Frequency part: Formulation Viewpoint: view multiple F0 estimation as a parameter estimation problem from observations in the frequency domain. Parameters to be estimated: Polyphony (number of F0s) F0s Observations: the complex spectrum A Maximum Likelihood method: p(A, h) Acoustic materials: 1500 notes from the Iowa music database 18 wind and arco-string instruments C2 (65Hz) – B6 (1976Hz), mf & ff Training data: 500 notes Testing data: generated using the other 1000 notes Mixed with equal mean square level 1000 mixtures each for polyphony 1, 2, 3 and 4 F0s estimation: White bar: predominant F0 Grey bar: multiple F0 Black bar: multiple F0 without counting octave(s) errors Upper figure: our results Lower figure: using the Gaussian distribution to model the frequency deviation of the true peaks. The predominant-F0 remains almost the same with the increase of polyphony: the greedy search strategy is feasible. The octave errors take up almost the half of all the multiple-F0 errors: the inherent limitations of our algorithm; these errors are not that annoying in some scenarios, e.g. chord recognition. The upper figure results are better than the lower: the statistical information about the peaks in the monophonic training data is more helpful than a usually used non-informative Gaussian model. Polyphony estimation: The weighted BIC is still not a proper method. Histogram of the polyphony estimates Amplitude part Frequency part where is the F0 that generates peak i. Assum. 4: each true peak is generated by only one F0. a) The amplitude part: Change the conditions: F0 harmonic number of peak i, since the correlation between Ai and F0 is much smaller than that between Ai and hi. Estimate the polyphony: The likelihood will increase with the number of F0s Addressed by a weighted Bayesian Information Criteria Find the F0s and polyphony that maximize BIC The weight is adjusted manually and found proper for polyphony 1 to 4 Log likelihood The 3-d joint probability density is estimated using a Parzen window (11*11*5), as illustrated by the three 2-d marginal density in following figures: weight BIC penalty A greedy search strategy: A combinational explosion problem Estimate F0s one by one Stop when BIC begins to decrease Discussions How to “bootstrap” the modeling of the peaks in the testing data themselves? Iteratively learn the statistics and discriminate the “true” and “false” peaks in the testing data. Extend to the quasi-harmonic sounds, e.g. piano sounds. How to deal with the inherent limitation that being tend to estimate the half F0s? How about rectifying the likelihood function, such as increasing the spectral amplitudes at the harmonic positions of the F0s into the observation. Integrate sound source separation into the algorithm and consider the time dependent information.


