MINISTER FOR TRANSPORT AND MINISTER FOR ROADS 67 DEPARTMENT OF TRANSPORT
advertisement
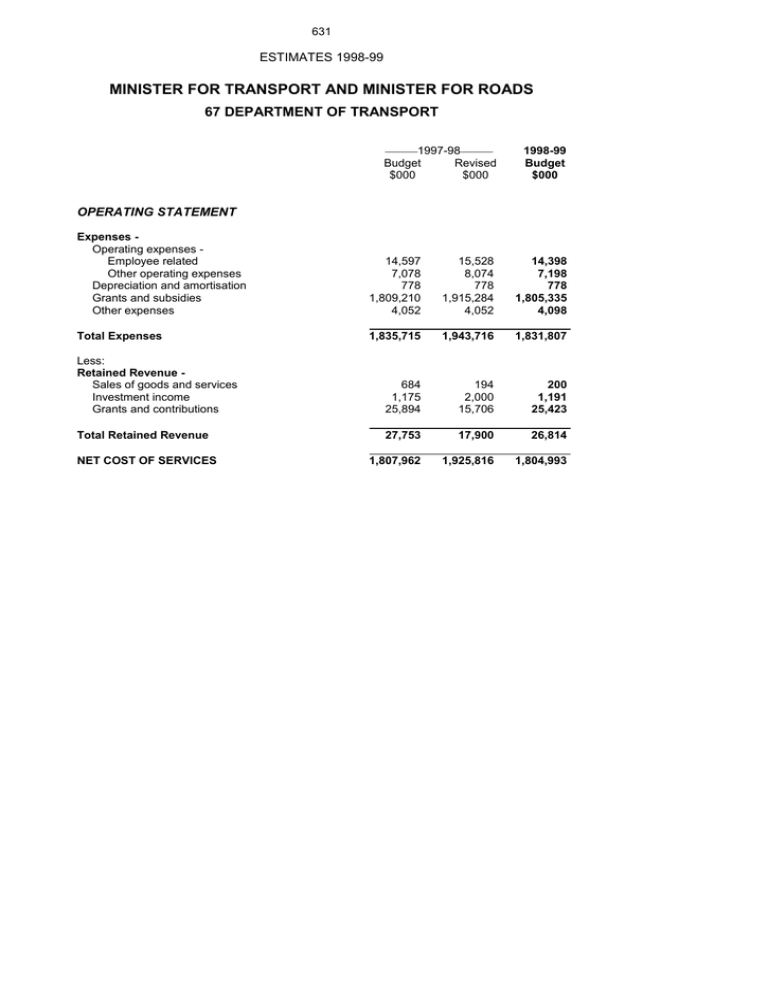
631 ESTIMATES 1998-99 MINISTER FOR TRANSPORT AND MINISTER FOR ROADS 67 DEPARTMENT OF TRANSPORT _______1997-98_______ Budget $000 Revised $000 1998-99 Budget $000 Expenses Operating expenses Employee related Other operating expenses Depreciation and amortisation Grants and subsidies Other expenses 14,597 7,078 778 1,809,210 4,052 15,528 8,074 778 1,915,284 4,052 14,398 7,198 778 1,805,335 4,098 Total Expenses 1,835,715 1,943,716 1,831,807 Less: Retained Revenue Sales of goods and services Investment income Grants and contributions 684 1,175 25,894 194 2,000 15,706 200 1,191 25,423 Total Retained Revenue 27,753 17,900 26,814 1,807,962 1,925,816 1,804,993 OPERATING STATEMENT NET COST OF SERVICES 632 ESTIMATES 1998-99 MINISTER FOR TRANSPORT AND MINISTER FOR ROADS 67 DEPARTMENT OF TRANSPORT _______1997-98_______ Revised $000 1998-99 Budget $000 14,009 1,915,284 7,335 12,920 1,805,335 10,984 1,936,628 1,829,239 Receipts Sale of goods and services Other 175 18,424 200 26,530 Total Receipts 18,599 26,730 (1,918,029) (1,802,509) CASH FLOWS FROM INVESTING ACTIVITIES Proceeds from sale of property, plant and equipment Purchases of property, plant and equipment 3 (1,143) ... (490) NET CASH FLOWS FROM INVESTING ACTIVITIES (1,140) (490) CASH FLOWS FROM GOVERNMENT Recurrent appropriation 1,792,927 Capital appropriation 14,069 Cash reimbursements from the Consolidated Fund Entity 1,903,412 15,523 280 1,784,093 13,567 272 NET CASH FLOWS FROM GOVERNMENT 1,919,215 1,797,932 46 (5,067) 21,165 21,211 21,211 16,144 Budget $000 CASH FLOW STATEMENT Payments Employee related Grants and subsidies Other Total Payments NET CASH FLOWS FROM OPERATING ACTIVITIES NET INCREASE/(DECREASE) IN CASH Opening cash and cash equivalents CLOSING CASH AND CASH EQUIVALENTS 633 ESTIMATES 1998-99 MINISTER FOR TRANSPORT AND MINISTER FOR ROADS 67 DEPARTMENT OF TRANSPORT _______1997-98_______ Revised $000 1998-99 Budget $000 CASH FLOW RECONCILIATION Net cost of services Non cash items added back Change in operating assets and liabilities (1,925,816) 2,397 5,390 (1,804,993) 2,316 168 Net cash flow from operating activities (1,918,029) (1,802,509) Budget $000 CASH FLOW STATEMENT (cont) 634 ESTIMATES 1998-99 MINISTER FOR TRANSPORT AND MINISTER FOR ROADS 67 DEPARTMENT OF TRANSPORT _______1997-98_______ Revised $000 1998-99 Budget $000 21,211 2,185 9,822 16,144 2,347 9,822 Total Current Assets 33,218 28,313 Non Current Assets Property, plant and equipment Cost/valuation Accumulated depreciation Investments Receivables 6,040 (4,430) 97,400 220 6,530 (5,208) 97,400 140 Total Non Current Assets 99,230 98,862 132,448 127,175 LIABILITIES Current Liabilities Accounts payable Employee entitlements Other 26,220 1,050 167 26,652 1,050 167 Total Current Liabilities 27,437 27,869 Non Current Liabilities Other 396 214 Total Non Current Liabilities 396 214 27,833 28,083 NET ASSETS 104,615 99,092 EQUITY Accumulated funds 104,615 99,092 TOTAL EQUITY 104,615 99,092 Budget $000 STATEMENT OF FINANCIAL POSITION ASSETS Current Assets Cash Receivables Other Total Assets Total Liabilities 635 ESTIMATES 1998-99 MINISTER FOR TRANSPORT AND MINISTER FOR ROADS 67 DEPARTMENT OF TRANSPORT 67.1 Development, Co-ordination and Planning of Transport Services 67.1.1 Development, Co-ordination and Planning of Transport Services Program Objective(s): To meet the transport needs of the New South Wales community in an optimal way, balancing social and economic objectives. Program Description: Development of transport objectives in New South Wales and the overall strategies and policies for achieving them. Advice to the Minister, implementation of self-regulation by the private sector. Development of appropriate monitoring and regulatory activities. Average Staffing (EFT) 1997-98 1998-99 116 10 28 22 14 6 32 9 116 10 28 23 14 ... 28 8 237 227 Activities: Transport Services Transport Planning Policy and Projects Transport Safety Bureau Transport Data Centre Ministerial Office Corporate Services Other _______1997-98_______ Budget $000 Revised $000 1998-99 Budget $000 13,616 7,078 778 15,528 8,074 778 14,398 7,198 778 OPERATING STATEMENT Expenses Operating expenses Employee related Other operating expenses Depreciation and amortisation 636 ESTIMATES 1998-99 MINISTER FOR TRANSPORT AND MINISTER FOR ROADS 67 DEPARTMENT OF TRANSPORT 67.1 Development, Co-ordination and Planning of Transport Services 67.1.1 Development, Co-ordination and Planning of Transport Services (cont) OPERATING STATEMENT (cont) Grants and subsidies Chartered Institute of Transport Light Rail project Public transport infrastructure Compensation to the National Rail Corporation Other expenses Refunds and remissions of Crown revenue 3 106 28,011 4,800 ... 700 28,523 4,127 ... ... 40,607 ... 100 100 100 Total Expenses 54,492 57,830 63,081 Less: Retained Revenue Sales of goods and services Investment income Grants and contributions 684 1,175 16,391 194 2,000 5,845 200 1,191 15,695 Total Retained Revenue 18,250 8,039 17,086 NET COST OF SERVICES 36,242 49,791 45,995 1,000 1,047 490 ASSET ACQUISITIONS 637 ESTIMATES 1998-99 MINISTER FOR TRANSPORT AND MINISTER FOR ROADS 67 DEPARTMENT OF TRANSPORT 67.2 Provision of Transport Services 67.2.1 Assistance for General Track and Freight Services Program Objective(s): To assist freight transport users confronted with long distances to markets and ports, and to maintain the rail network at its existing standard. Program Description: Provision of subsidies to Freight Rail Corporation for rail freight services which it would not otherwise provide at the price charged to freight users, and a subsidy to the Rail Access Corporation to ensure mainly rural non-commercial rail infrastructure is maintained at its existing standard. _______1997-98_______ Budget Revised $000 $000 1998-99 Budget $000 OPERATING STATEMENT Expenses Grants and subsidies Freight Rail services Rail Access Corporation - line services 90,000 177,000 90,000 177,000 80,000 175,000 Total Expenses 267,000 267,000 255,000 NET COST OF SERVICES 267,000 267,000 255,000 638 ESTIMATES 1998-99 MINISTER FOR TRANSPORT AND MINISTER FOR ROADS 67 DEPARTMENT OF TRANSPORT 67.2 Provision of Transport Services 67.2.2 Purchase of Public Transport Services Program Objective(s): To improve community mobility on public and private transport. Program Description: Provision of funds to the State Rail Authority, State Transit Authority, Rail Access Corporation and private transport operators for services and concessions which would not otherwise be provided by them at the current fare and/or service levels, and for new rail infrastructure, to enable rail entities to operate more efficiently, and to community groups and certain individuals for particular services. Units 1995-96 1996-97 1997-98 1998-99 Outputs: CityRail services Total concession trips mill Average concession subsidy per trip $ Total passengers, including concession recipients mill Average subsidy per trip, including concessions $ Average subsidy per trip, excluding concessions $ Countrylink services Total concession trips mill Average concession subsidy per trip $ Total passengers, including concession recipients mill Average subsidy per trip, including concessions $ Average subsidy, excluding concessions* $ State Transit bus and ferry services Total concession trips mill Average concession subsidy per trip $ Total passengers, including concession recipients mill Average subsidy per trip, including concessions $ Average subsidy per trip, excluding concessions $ School Student Transport Scheme Total beneficiaries thous Cost per beneficiary ($1998-99) $ * 55.9 2.01 255.2 74.3 n.a. 79.6 1.68 266.0 80.6 1.68 272.0 277.9 3.08 n.a. 1.56 2.53 n.a. 1.07 1.7 37.94 1.6 41.94 1.6 42.38 2.6 2.7 2.7 36.23 10.91 26.37 1.26 26.37 0.88 2.6 30.77 5.96 105.9 1.01 109.0 1.02 110.4 1.08 1.48 1.00 1.6 43.00 112.7 1.07 203.3 207.2 0.71 0.73 0.09 0.19 0.20 0.21 645.9 510.30 649.8 531.18 653.2 563.11 638.8 521.33 212.8 0.76 219.0 0.76 The reduction in 1997-98 reflects an adjustment in the CountryLink Access Charge, which was reduced from $42 million in 1996-97 to $12 million in 1997-98. 639 ESTIMATES 1998-99 MINISTER FOR TRANSPORT AND MINISTER FOR ROADS 67 DEPARTMENT OF TRANSPORT 67.2 Provision of Transport Services 67.2.2 Purchase of Public Transport Services (cont) _______1997-98_______ Budget $000 Revised $000 1998-99 Budget $000 317,816 29,521 497,500 156,753 300,400 99,100 47,200 ... ... 40,000 21,000 317,816 29,524 495,525 161,369 225,200 114,500 48,900 6,500 78,500 104,300 32,800 339,937 31,451 483,650 166,500 148,600 123,300 64,390 ... 75,000 8,900 68,000 3,952 3,952 3,998 1,513,242 1,618,886 1,513,726 Less: Retained Revenue Grants and contributions 9,503 9,861 9,728 Total Retained Revenue 9,503 9,861 9,728 1,503,739 1,609,025 1,503,998 OPERATING STATEMENT Expenses Grants and subsidies Private operators of buses, taxis and ferries Community groups and certain individuals SRA CityRail services STA bus and ferry services SRA - capital grants* Maintenance grant to SRA RAC - capital grant Equity contribution to RSA SRA - transitional payment SRA redundancies RSA redundancies Other expenses Contracted passenger services Total Expenses NET COST OF SERVICES * SRA’s Capital Grant for Revised 1997-98 and Budget 1998-99 is shown net of SRA’s asset sale proceeds, which are estimated at $53.6 million in 1997-98 and $129.6 million in 1998-99. 640 ESTIMATES 1998-99 MINISTER FOR TRANSPORT AND MINISTER FOR ROADS 68 ROADS AND TRAFFIC AUTHORITY _______1997-98_______ Budget $000 Revised $000 1998-99 Budget $000 134,401 ... 631,400 20,331 87,543 109,665 156,657 125,010 850 636,992 24,300 46,829 109,968 171,692 128,410 650 650,479 22,601 62,570 108,217 168,160 1,139,997 1,115,641 1,141,087 Less: Retained Revenue Sales of goods and services Investment income Grants and contributions Other revenue 122,925 15,122 6,375 30,385 131,600 6,615 11,400 39,155 136,720 7,374 17,150 23,004 Total Retained Revenue 174,807 188,770 184,248 ... 10,800 ... 965,190 916,071 956,839 OPERATING STATEMENT Expenses Operating expenses Employee related Other operating expenses Maintenance Depreciation and amortisation Grants and subsidies Finance costs Other expenses Total Expenses Gain/(loss) on sale of non current assets NET COST OF SERVICES 641 ESTIMATES 1998-99 MINISTER FOR TRANSPORT AND MINISTER FOR ROADS 68 ROADS AND TRAFFIC AUTHORITY _______1997-98_______ Revised $000 1998-99 Budget $000 118,476 46,829 109,968 771,384 130,410 62,570 108,217 793,136 1,046,657 1,094,333 Receipts Sale of goods and services Other 131,500 25,801 138,855 21,454 Total Receipts 157,301 160,309 NET CASH FLOWS FROM OPERATING ACTIVITIES (889,356) (934,024) CASH FLOWS FROM INVESTING ACTIVITIES Proceeds from sale of property, plant and equipment Proceeds from sale of investments Purchases of property, plant and equipment Purchases of investments 37,546 100,000 (883,326) ... 64,200 ... (881,371) (65,000) NET CASH FLOWS FROM INVESTING ACTIVITIES (745,780) (882,171) CASH FLOWS FROM FINANCING ACTIVITIES Repayment of borrowings and advances (36,010) (14,185) NET CASH FLOWS FROM FINANCING ACTIVITIES (36,010) (14,185) Budget $000 CASH FLOW STATEMENT CASH FLOWS FROM OPERATING ACTIVITIES Payments Employee related Grants and subsidies Finance costs Other Total Payments 642 ESTIMATES 1998-99 MINISTER FOR TRANSPORT AND MINISTER FOR ROADS 68 ROADS AND TRAFFIC AUTHORITY _______1997-98_______ Budget $000 Revised $000 1998-99 Budget $000 959,369 871,800 895,647 794,640 943,358 875,022 1,690,287 1,818,380 19,141 (12,000) 33,950 53,091 53,091 41,091 CASH FLOW RECONCILIATION Net cost of services Non cash items added back Change in operating assets and liabilities (916,071) 17,452 9,263 (956,839) (270) 23,085 Net cash flow from operating activities (889,356) (934,024) CASH FLOW STATEMENT (cont) CASH FLOWS FROM GOVERNMENT Recurrent appropriation Capital appropriation NET CASH FLOWS FROM GOVERNMENT NET INCREASE/(DECREASE) IN CASH Opening cash and cash equivalents CLOSING CASH AND CASH EQUIVALENTS 643 ESTIMATES 1998-99 MINISTER FOR TRANSPORT AND MINISTER FOR ROADS 68 ROADS AND TRAFFIC AUTHORITY _______1997-98_______ Revised $000 1998-99 Budget $000 53,091 91,543 23,802 6,739 2,563 41,091 156,543 21,517 6,636 1,563 177,738 227,350 Non Current Assets Property, plant and equipment Cost/valuation Accumulated depreciation Receivables Other 44,156,391 (4,369,643) 36,316 521,290 44,988,628 (4,407,310) 36,316 544,264 Total Non Current Assets 40,344,354 41,161,898 Total Assets 40,522,092 41,389,248 LIABILITIES Current Liabilities Accounts payable Borrowings Employee entitlements Other provisions Other 235,251 130,087 79,931 6,252 38,807 260,151 115,902 79,431 6,252 38,807 Total Current Liabilities 490,328 500,543 Non Current Liabilities Borrowings Employee entitlements Other 979,493 343,182 477,222 979,493 341,682 474,122 Total Non Current Liabilities 1,799,897 1,795,297 Total Liabilities 2,290,225 2,295,840 38,231,867 39,093,408 Budget $000 STATEMENT OF FINANCIAL POSITION ASSETS Current Assets Cash Investments Receivables Inventories Other Total Current Assets NET ASSETS 644 ESTIMATES 1998-99 MINISTER FOR TRANSPORT AND MINISTER FOR ROADS 68 ROADS AND TRAFFIC AUTHORITY _______1997-98_______ Revised $000 1998-99 Budget $000 EQUITY Reserves Accumulated funds 3,443,410 34,788,457 3,443,410 35,649,998 TOTAL EQUITY 38,231,867 39,093,408 Budget $000 STATEMENT OF FINANCIAL POSITION (cont) 645 ESTIMATES 1998-99 MINISTER FOR TRANSPORT AND MINISTER FOR ROADS 68 ROADS AND TRAFFIC AUTHORITY PROGRAM SUMMARY _______1997-98_______ Budget Revised $000 $000 1998-99 Budget $000 TOTAL ROADS PROGRAM Operating expenses Capital expenditure 1,139,997 1,050,294 1,115,641 947,198 1,141,087 943,974 Total Roads Program 2,190,291 2,062,839 2,085,061 363,320 18,100 8,900 673,000 579,000 ... 2,000 119,620 52,000 15,229 318,411 12,080 8,900 672,000 507,000 15,000 2,600 115,920 25,000 13,376 310,550 12,400 9,100 686,000 599,000 36,000 2,100 118,820 30,000 14,410 1,831,169 1,690,287 1,818,380 Consolidated Fund Appropriations to the Total Roads Program Commonwealth road funds Commonwealth blackspot program Interstate vehicle registration fees Motor vehicle taxation Commonwealth fuel taxes Registration and transfer fees Heavy vehicle overloading fines Untied funding M4/M5 cashback rebates Other Total SUMMARY OF AVERAGE STAFFING Average Staffing (EFT) AUTHORITY TOTAL 1997-98 1998-99 6,594 6,432 (Details of average staffing for the Authority are not available across programs) 646 ESTIMATES 1998-99 MINISTER FOR TRANSPORT AND MINISTER FOR ROADS 68 ROADS AND TRAFFIC AUTHORITY 68.1 Road Network Infrastructure 68.1.1 Network Development Program Objective(s): To develop the State's road network to promote economic growth, safer roads and contribute to a totally integrated transport solution. Program Description: Planning, designing, scheduling and organising the development of road and bridge works. Units 1995-96 1996-97 1997-98 1998-99 $m 2,650 2,230 2,500 2,500 % 51 55 55 60 % % 87 94 81 89 90 90 90 90 Outcomes: Value of benefit of annual development program Community satisfaction with road network development Outputs: Major works completed within 10% of planned duration after approved date 10% over authorised cost _______1997-98_______ Budget Revised $000 $000 1998-99 Budget $000 OPERATING STATEMENT Expenses Operating expenses Employee related Other operating expenses Maintenance Grants and subsidies Grants to agencies Local Government - capital grants Finance costs Interest Guarantee fee payments 8,820 ... 3,667 6,866 423 ... 4,487 289 ... ... 5,815 425 8,239 2,500 10,280 106,665 3,000 106,968 3,000 105,217 3,000 647 ESTIMATES 1998-99 MINISTER FOR TRANSPORT AND MINISTER FOR ROADS 68 ROADS AND TRAFFIC AUTHORITY 68.1 Road Network Infrastructure 68.1.1 Network Development (cont) OPERATING STATEMENT (cont) Other expenses Property, plant and equipment revaluation decrement ... Sydney Harbour Tunnel Company operating payment 29,638 Sydney Harbour Bridge toll collection costs 1,796 15,973 29,153 1,927 ... 31,082 2,062 159,401 172,974 158,917 Less: Retained Revenue Sales of goods and services Rents and leases Road tolls Investment income Grants and contributions Other revenue 2,400 29,638 ... 4,000 21,885 3,100 29,153 4,100 3,400 39,155 3,100 31,082 4,100 9,150 23,004 Total Retained Revenue 57,923 78,908 70,436 ... 10,800 ... NET COST OF SERVICES 101,478 83,266 88,481 ASSET ACQUISITIONS 868,886 749,434 758,091 Total Expenses Gain/(loss) on sale of non current assets 648 ESTIMATES 1998-99 MINISTER FOR TRANSPORT AND MINISTER FOR ROADS 68 ROADS AND TRAFFIC AUTHORITY 68.1 Road Network Infrastructure 68.1.2 Maintenance Program Objective(s): To properly maintain State road and bridge assets at minimum whole of life cost. Program Description: Planning, designing, scheduling and organising of work for the maintenance of roads and bridges, including restoration after natural disasters. Units 1995-96 1996-97 1997-98 1998-99 % % % 74 21 5 74 21 5 75 20 5 77 19 4 % % % 87 10 3 87 10 3 87 10 3 88 9 3 $000 23 24 $000 11 11 Outcomes: Pavement durability Good Fair Poor Ride Quality Good Fair Poor Outputs: Maintenance expenditure on National Highways and State Roads per kilometre of roadway per million vehicle kilometres travelled _______1997-98_______ Budget Revised $000 $000 23 23 10 10 1998-99 Budget $000 OPERATING STATEMENT Expenses Operating expenses Employee related Other operating expenses Maintenance Depreciation and amortisation 9,160 ... 503,027 6,936 2,000 223 517,138 8,100 1,500 190 515,413 7,533 Total Expenses 519,123 527,461 524,636 649 ESTIMATES 1998-99 MINISTER FOR TRANSPORT AND MINISTER FOR ROADS 68 ROADS AND TRAFFIC AUTHORITY 68.1 Road Network Infrastructure 68.1.2 Maintenance (cont) OPERATING STATEMENT (cont) Less: Retained Revenue Sales of goods and services Rents and leases Permits Road tolls Minor sales of goods and services Investment income Grants and contributions Other revenue 12,500 500 26,862 7,325 15,122 2,375 3,666 12,500 600 25,447 13,950 2,515 2,000 ... 11,850 400 24,118 15,500 3,274 2,000 ... Total Retained Revenue 68,350 57,012 57,142 450,773 470,449 467,494 18,244 31,837 32,158 NET COST OF SERVICES ASSET ACQUISITIONS 650 ESTIMATES 1998-99 MINISTER FOR TRANSPORT AND MINISTER FOR ROADS 68 ROADS AND TRAFFIC AUTHORITY 68.2 Driver and Vehicle Policy and Regulation 68.2.1 Driver and Vehicle Policy and Regulation Program Objective(s): To encourage the use of roadworthy vehicles and responsible behaviour in all road users. Program Description: Planning, designing and implementing programs and minimum standards for the safe and efficient movement of traffic, for the appropriate education of road users, and for regulation and monitoring of vehicles. Units 1995-96 1996-97 1997-98 % % 3.5 8 3.5 8 3.5 7 mill mill 4.1 4.0 4.2 4.0 $ 4.13 4.32 thous thous 155 247 158 237 1998-99 Outcomes: Proportion of unlicensed driving Defective heavy road vehicles 3.5 7 Outputs: Licences on issue Registered vehicles Motor Registries Cost per transaction New licences issued (excluding renewals and upgrades) Driver/rider tests conducted _______1997-98_______ 4.3 4.1 4.4 4.1 4.40 166 240 4.40 168 239 Budget $000 Revised $000 1998-99 Budget $000 100,562 ... 8,371 110,135 91 10,125 116,726 77 9,418 78,753 20,521 76,873 13,288 81,224 15,340 208,207 210,512 222,785 OPERATING STATEMENT Expenses Operating expenses Employee related Other operating expenses Depreciation and amortisation Other expenses Registry customer services Driver and vehicle management Total Expenses 651 ESTIMATES 1998-99 MINISTER FOR TRANSPORT AND MINISTER FOR ROADS 68 ROADS AND TRAFFIC AUTHORITY 68.2 Driver and Vehicle Policy and Regulation 68.2.1 Driver and Vehicle Policy and Regulation (cont) OPERATING STATEMENT (cont) Less: Retained Revenue Sales of goods and services Plate fees Third party insurance data access fees Fine default fees - commission Minor sales of goods and services 16,800 8,600 5,600 12,700 19,800 8,600 5,600 12,850 25,000 8,870 3,200 13,600 Total Retained Revenue 43,700 46,850 50,670 164,507 163,662 172,115 1,562 9,000 6,500 NET COST OF SERVICES ASSET ACQUISITIONS 652 ESTIMATES 1998-99 MINISTER FOR TRANSPORT AND MINISTER FOR ROADS 68 ROADS AND TRAFFIC AUTHORITY 68.3 Road Safety and Traffic Management 68.3.1 Road Safety and Traffic Management Program Objective(s): To enhance road safety and traffic management in order to achieve reduced levels of road related death and serious injury, and reduced transport costs. Program Description: Improvements to the behaviour of road users through public and school education campaigns, focusing on the main factors which contribute to serious accidents, such as drink driving, speeding, driver fatigue, non-use of seat belts and child restraints, and pedestrian behaviour. Traffic management activities including planning, designing and organising public transport infrastructure improvements, local area black spot treatments, and improvements for the safety and convenience of pedestrians and cyclists. Units 1995-96 1996-97 1997-98 1998-99 no. 6,769 6,494 6,349 6,207 no. 110 104 101 97 no. 13.4 12.7 % % 71.9 76.6 no. no. % 2,765 417 50 Outcomes: Serious casualties Serious casualties per 100,000 population Serious casualties per 100 million vehicle kilometres travelled Proportion of Sydney State Road network with vehicles averaging 35 km/h or better during Morning peak Afternoon peak 70.0 75.0 12.2 11.8 70.0 75.0 69.0 74.0 Outputs: Traffic signals in operation School crossings supervisor sites School Safety Zone creation 2,870 447 60 2,957 480 70 3,040 510 80 653 ESTIMATES 1998-99 MINISTER FOR TRANSPORT AND MINISTER FOR ROADS 68 ROADS AND TRAFFIC AUTHORITY 68.3 Road Safety and Traffic Management 68.3.1 Road Safety and Traffic Management (cont) _______1997-98_______ Budget $000 Revised $000 1998-99 Budget $000 15,859 ... 124,706 5,024 6,009 113 119,854 6,075 5,697 94 135,066 5,650 17,843 5,885 4,620 5,545 14,895 4,895 25,949 34,478 38,452 195,266 176,694 204,749 Less: Retained Revenue Grants and contributions Other revenue ... 4,834 6,000 ... 6,000 ... Total Retained Revenue 4,834 6,000 6,000 190,432 170,694 198,749 99,205 122,820 99,688 OPERATING STATEMENT Expenses Operating expenses Employee related Other operating expenses Maintenance Depreciation and amortisation Grants and subsidies Public Transport Infrastructure Improvement Program Road safety programs Other expenses Road Safety Total Expenses NET COST OF SERVICES ASSET ACQUISITIONS 654 ESTIMATES 1998-99 MINISTER FOR TRANSPORT AND MINISTER FOR ROADS 68 ROADS AND TRAFFIC AUTHORITY 68.4 M4/M5 Cashback Scheme 68.4.1 M4/M5 Cashback Rebates Program Objective(s): To reimburse tolls to motorists driving NSW privately registered vehicles on the M4 and M5 Motorways. Program Description: Reimbursing motorists directly for tolls paid using Cashback Cards on the M4 and M5 Motorways when driving NSW privately registered cars and motorcycles. Units 1995-96 no. ... 1996-97 1997-98 1998-99 Outputs: M4/M5 cashback cardholders paid 55,000 65,000 _______1997-98_______ 75,000 Budget $000 Revised $000 1998-99 Budget $000 Expenses Grants and subsidies Road toll rebates 58,000 28,000 30,000 Total Expenses 58,000 28,000 30,000 NET COST OF SERVICES 58,000 28,000 30,000 OPERATING STATEMENT
