Document 16047497
advertisement

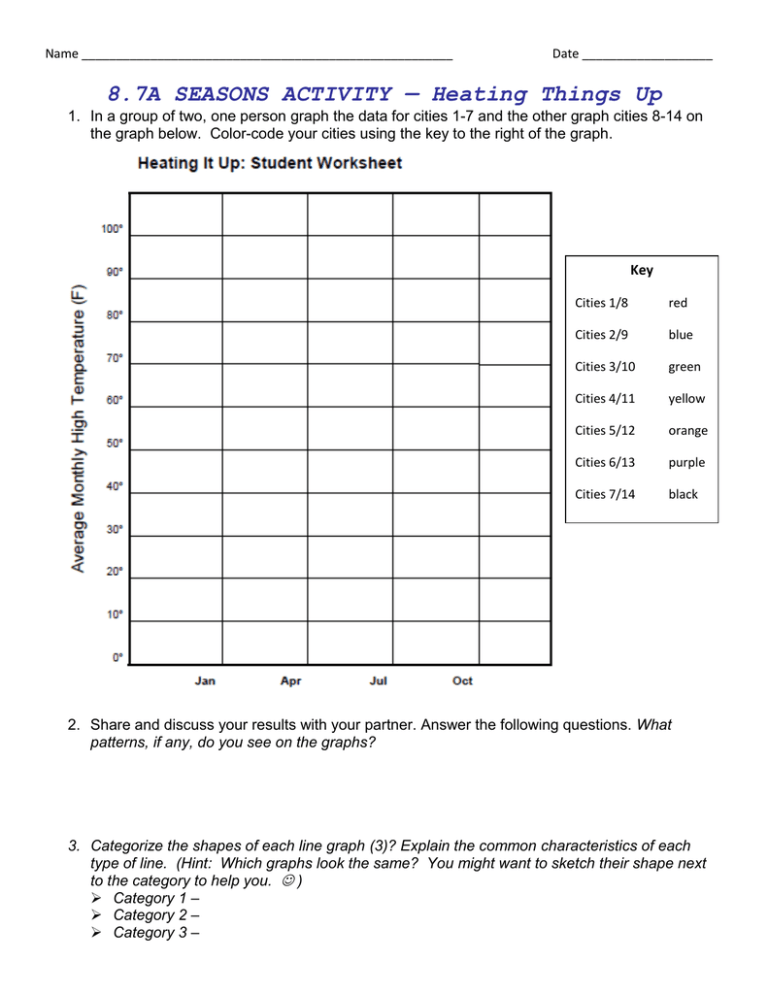
Name ______________________________________________________ Date ___________________ 8.7A SEASONS ACTIVITY — Heating Things Up 1. In a group of two, one person graph the data for cities 1-7 and the other graph cities 8-14 on the graph below. Color-code your cities using the key to the right of the graph. Key Cities 1/8 red Cities 2/9 blue Cities 3/10 green Cities 4/11 yellow Cities 5/12 orange Cities 6/13 purple Cities 7/14 black 2. Share and discuss your results with your partner. Answer the following questions. What patterns, if any, do you see on the graphs? 3. Categorize the shapes of each line graph (3)? Explain the common characteristics of each type of line. (Hint: Which graphs look the same? You might want to sketch their shape next to the category to help you. ) Category 1 – Category 2 – Category 3 – Name ______________________________________________________ Date ___________________ 4. Whole Group: Use the map provided below, place a green dot for _______ lines, a red dot for _______ lines, and a blue dot for ______ lines where that city is. Plot each city on the map below using green, red, or blue. Be sure to label the city next to the colored dot! If you do not know where a city is, research it using Google Earth! When instructed, one student from each group will place a dot for each city on the large map. 5. Discuss what they see with your partner on the large map. Is there a pattern to the colors of the dots? EXPLAIN. What happened to the cities to the north of the equator? What happened to the cities on the equator? What happened to the cities to the south of the equator?

