Document 15973969
advertisement

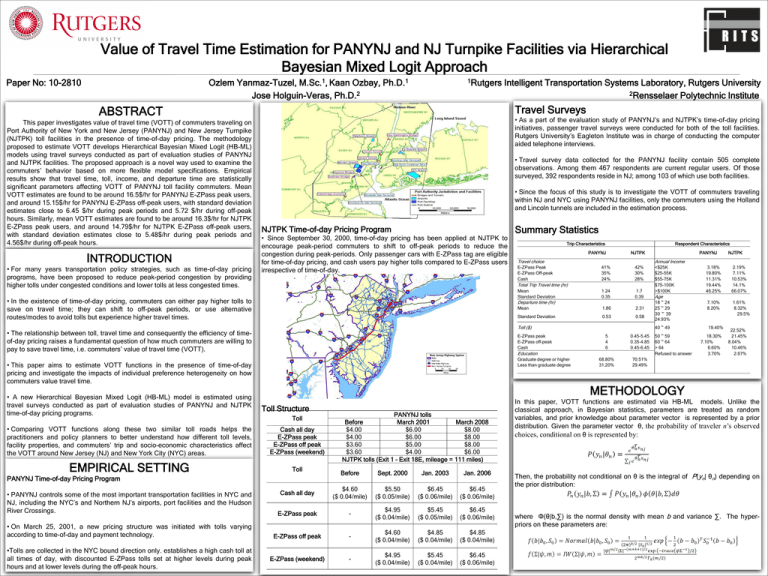
Value of Travel Time Estimation for PANYNJ and NJ Turnpike Facilities via Hierarchical Bayesian Mixed Logit Approach Paper No: 10-2810 Ozlem Yanmaz-Tuzel, M.Sc.1, Kaan Ozbay, Ph.D.1 Jose Holguin-Veras, Ph.D.2 1Rutgers Intelligent Transportation Systems Laboratory, Rutgers University 2Rensselaer Polytechnic Institute Travel Surveys ABSTRACT This paper investigates value of travel time (VOTT) of commuters traveling on Port Authority of New York and New Jersey (PANYNJ) and New Jersey Turnpike (NJTPK) toll facilities in the presence of time-of-day pricing. The methodology proposed to estimate VOTT develops Hierarchical Bayesian Mixed Logit (HB-ML) models using travel surveys conducted as part of evaluation studies of PANYNJ and NJTPK facilities. The proposed approach is a novel way used to examine the commuters’ behavior based on more flexible model specifications. Empirical results show that travel time, toll, income, and departure time are statistically significant parameters affecting VOTT of PANYNJ toll facility commuters. Mean VOTT estimates are found to be around 16.5$/hr for PANYNJ E-ZPass peak users, and around 15.15$/hr for PANYNJ E-ZPass off-peak users, with standard deviation estimates close to 6.45 $/hr during peak periods and 5.72 $/hr during off-peak hours. Similarly, mean VOTT estimates are found to be around 16.3$/hr for NJTPK E-ZPass peak users, and around 14.79$/hr for NJTPK E-ZPass off-peak users, with standard deviation estimates close to 5.48$/hr during peak periods and 4.56$/hr during off-peak hours. INTRODUCTION • For many years transportation policy strategies, such as time-of-day pricing programs, have been proposed to reduce peak-period congestion by providing higher tolls under congested conditions and lower tolls at less congested times. • As a part of the evaluation study of PANYNJ’s and NJTPK’s time-of-day pricing initiatives, passenger travel surveys were conducted for both of the toll facilities. Rutgers University’s Eagleton Institute was in charge of conducting the computer aided telephone interviews. • Travel survey data collected for the PANYNJ facility contain 505 complete observations. Among them 467 respondents are current regular users. Of those surveyed, 392 respondents reside in NJ; among 103 of which use both facilities. • Since the focus of this study is to investigate the VOTT of commuters traveling within NJ and NYC using PANYNJ facilities, only the commuters using the Holland and Lincoln tunnels are included in the estimation process. NJTPK Time-of-day Pricing Program • Since September 30, 2000, time-of-day pricing has been applied at NJTPK to encourage peak-period commuters to shift to off-peak periods to reduce the congestion during peak-periods. Only passenger cars with E-ZPass tag are eligible for time-of-day pricing, and cash users pay higher tolls compared to E-ZPass users irrespective of time-of-day. Travel choice E-ZPass Peak E-ZPass Off-peak Cash 41% 35% 24% 42% 30% 28% 1.24 0.35 1.7 0.39 Mean 1.86 2.31 Standard Deviation 0.53 0.58 E-ZPass peak E-ZPass off-peak Cash 5 4 6 0.45-5.45 0.35-4.85 0.45-6.45 68.80% 31.20% 70.51% 29.49% Education Graduate degree or higher Less than graduate degree PANYNJ NJTPK Annual Income Toll ($) <$25K $25-55K $55-75K $75-100K >$100K 3.18% 19.80% 11.31% 19.44% 46.25% 2.19% 7.11% 10.53% 14.1% 66.07% 18 ~ 24 25 ~ 29 30 ~ 39 24.93% 7.10% 8.20% 1.61% 8.32% 29.5% 40 ~ 49 19.40% Age 50 ~ 59 60 ~ 64 > 64 Refused to answer 18.30% 7.10% 6.60% 3.70% 22.52% 21.45% 8.04% 10.46% 2.67% METHODOLOGY Toll Structure Toll • Comparing VOTT functions along these two similar toll roads helps the practitioners and policy planners to better understand how different toll levels, facility properties, and commuters’ trip and socio-economic characteristics affect the VOTT around New Jersey (NJ) and New York City (NYC) areas. Cash all day E-ZPass peak E-ZPass off peak E-ZPass (weekend) EMPIRICAL SETTING Toll PANYNJ Time-of-day Pricing Program •Tolls are collected in the NYC bound direction only. establishes a high cash toll at all times of day, with discounted E-ZPass tolls set at higher levels during peak hours and at lower levels during the off-peak hours. NJTPK Departure time (hr) • This paper aims to estimate VOTT functions in the presence of time-of-day pricing and investigate the impacts of individual preference heterogeneity on how commuters value travel time. • On March 25, 2001, a new pricing structure was initiated with tolls varying according to time-of-day and payment technology. Respondent Characteristics PANYNJ Mean Standard Deviation • The relationship between toll, travel time and consequently the efficiency of timeof-day pricing raises a fundamental question of how much commuters are willing to pay to save travel time, i.e. commuters’ value of travel time (VOTT). • PANYNJ controls some of the most important transportation facilities in NYC and NJ, including the NYC’s and Northern NJ’s airports, port facilities and the Hudson River Crossings. Trip Characteristics Total Trip Travel time (hr) • In the existence of time-of-day pricing, commuters can either pay higher tolls to save on travel time; they can shift to off-peak periods, or use alternative routes/modes to avoid tolls but experience higher travel times. • A new Hierarchical Bayesian Mixed Logit (HB-ML) model is estimated using travel surveys conducted as part of evaluation studies of PANYNJ and NJTPK time-of-day pricing programs. Summary Statistics Cash all day E-ZPass peak E-ZPass off peak E-ZPass (weekend) PANYNJ tolls Before March 2001 March 2008 $4.00 $6.00 $8.00 $4.00 $6.00 $8.00 $3.60 $5.00 $8.00 $3.60 $4.00 $6.00 NJTPK tolls (Exit 1 – Exit 18E, mileage = 111 miles) Before Sept. 2000 Jan. 2003 Jan. 2006 $4.60 ($ 0.04/mile) $5.50 ($ 0.05/mile) $6.45 ($ 0.06/mile) $6.45 ($ 0.06/mile) - $4.95 ($ 0.04/mile) $5.45 ($ 0.05/mile) $6.45 ($ 0.06/mile) - $4.60 ($ 0.04/mile) $4.85 ($ 0.04/mile) $4.85 ($ 0.04/mile) - $4.95 ($ 0.04/mile) $5.45 ($ 0.04/mile) $6.45 ($ 0.06/mile) In this paper, VOTT functions are estimated via HB-ML models. Unlike the classical approach, in Bayesian statistics, parameters are treated as random variables, and prior knowledge about parameter vector is represented by a prior distribution. Given the parameter vector θ, the probability of traveler n’s observed choices, conditional on θ is represented by: Then, the probability not conditional on θ is the integral of P(yn| θn) depending on the prior distribution: where Φ(θ|b,∑) is the normal density with mean b and variance ∑. The hyperpriors on these parameters are: Value of Travel Time Estimation for PANYNJ and NJ Turnpike Facilities via Hierarchical Bayesian Mixed Logit Approach Paper No: 10-2810 Ozlem Yanmaz-Tuzel1, Kaan Ozbay1 Jose Holguin-Veras2 In Bayesian approach, there is a precise relationship between prior and the posterior distribution linked through the likelihood function. Let L(Y| θ) be likelihood function of the observed data, formulated as: Then, based on Bayes’ rule, the posterior distribution of the parameter vector, f(θ|Y), is represented as: 1Rutgers Intelligent Transportation Systems Laboratory, Rutgers University 2Rensselaer Polytechnic Institute VALUE OF TRAVEL TIME ESTIMATION RESULTS • In the context of time-of-day pricing, VOTT can be defined as the marginal rate of substitution of travel time for money in a commuter’s utility function; which represents the relative desirability of available alternatives. • When the utility function is estimated via discrete choice models, VOTT for commuter n is calculated as the ratio between the partial derivative of the utility function with respect to travel time and with respect to travel cost. where f(b) is Normal(b|b0, S0) with large variance and f(∑) is IW(∑|ψ,m) ESTIMATION RESULTS • This section describes the HB-ML estimation results, where travelers choose their departure time in the presence of time-of-day pricing. The available alternatives for the travelers are (a) off-peak travel with E-ZPass, (b) peak travel with E-ZPass, or (c) peak travel with manual payment (cash). CONCLUSIONS • This paper aims to investigate VOTT of commuters traveling on PANYNJ and NJTPK toll facilities in the presence of time-of-day pricing. • In order to test the performance of the proposed HB-ML model, we compared model diagnostics of the HB-ML model with classical ML model. In particular, for each model we have calculated pseudo-r2 value expressed as: where: D: Posterior expectation of the deviance (=-2*log(likelihood)) D0: Log likelihood at zero (β=0, except constants) • The estimation results revealed pseudo-r2 value of 0.236 classical ML model and pseudo-r2 value of 0.274 for the proposed HB-ML model. • These diagnostics confirm that the proposed HB-ML model performs and fits the data better and ML model may have converged to a local maximum. Thus, in situations where it is uncertain whether a global maximum has been obtained or the sample size is small, Bayesian procedures can be recommended, since they do not require the maximization of a likelihood function. Estimation results for PANYNJ and NJTPK facilities PANYNJ Variables Constant Tr Time (Tr Time)2 Toll Toll2 Tr Time*toll Dep. Time (Dep. Time)*(Tr Time) Income (Income)*(Tr Time) Education Age Employment Gender E-ZPass peak E-ZPass off-peak mean st dev mean st dev -1.408 0.078 -1.312 0.079 -0.949 0.078 -0.97 0.079 -0.353 0.077 -0.454 0.079 -0.169 0.078 -0.199 0.079 -0.032 0.008 -0.039 0.009 -0.331 0.078 -0.318 0.081 -0.643 0.078 -0.681 0.078 0.357 0.067 0.501 0.068 -0.459 0.06 -0.509 0.062 2.034 0.076 2.043 0.077 0.22 0.046 0.166 0.047 2.092 0.079 2.069 0.08 2.086 0.078 2.084 0.078 NJTPK E-ZPass offE-ZPass peak peak mean st dev mean st dev -1.229 0.049 -1.455 0.070 -1.591 0.244 -1.69 0.278 -0.429 0.106 -0.491 0.110 -0.892 0.112 -0.847 0.131 -0.49 0.110 -0.422 0.091 -0.97 0.146 -0.85 0.131 0.39 0.092 0.34 0.084 -0.497 0.071 -0.481 0.069 1.71 0.368 1.15 0.256 0.105 0.022 0.079 0.018 1.567 0.100 1.12 0.071 1.937 0.152 1.439 0.119 •The methodology proposed to estimate VOTT develops HB-ML models using travel surveys conducted as a part of evaluation study of PANYNJ and NJTPK time-of-day pricing program. • Mean VOTT estimates are found to be around 16.5$/hr (PANYNJ) and 16.3$/hr (NJTPK) for E-ZPass peak users, and around 15.15$/hr (PANYNJ) and 14.79$/hr (NJTPK) for E-ZPass off-peak users. • The standard deviation of VOTT estimates is close to 6.45$/hr (PANYNJ) and 5.48$/hr (NJTPK) during peak periods and 5.72$/hr (PANYNJ) and 4.56$/hr (NJTPK) during off-peak hours. • When compared with commuters traveling over the entire NJTPK commuters, the estimation results for NJTPK commuters using PANYNJ facilities show a similar behavior. • The mean VOTT values for each toll facility are very close to each other, while standard deviation values are slightly lower for commuters traveling over the entire NJTPK. •Empirical results obtained from travel survey data shows that the interaction terms involving travel time, toll, income and departure time, and their statistically significant coefficients, reveal a significant degree of observable heterogeneity in how commuters value the travel time provided by PANYNJ facilities. • The proposed HB-ML estimation methodology provides the researchers with a new way to examine the commuters’ behavior based on more flexible model specifications. • Estimation of heterogonous VOTT functions helps the practitioners and policy planners to better understand how different toll levels, facility properties, and commuters’ trip and socio-economic characteristics affect the valuation of travel time around New York Metropolitan area. •The comparison results with classical ML models reveal that, in situations where it is uncertain whether a global maximum has been obtained, •Bayesian approach is recommended, since it performs better and does not require maximization of the likelihood function. Even when the researcher is not interested in Bayesian interpretive approach, HB methodology may be pursued since the mean of the posterior should be close to the classical mean estimate. •Alternatively, classical estimators can be used where the researcher is uncertain whether the Bayesian procedure has converged to draws from the posterior. Thus, it is our view that Bayesian and classical estimators complement each other. •If the researcher is interested in individual-level coefficients, or the sample size is small, Bayesian procedures may result in better estimates compared with classical approaches.


