Romania Bucharest 230340 sq. km
advertisement
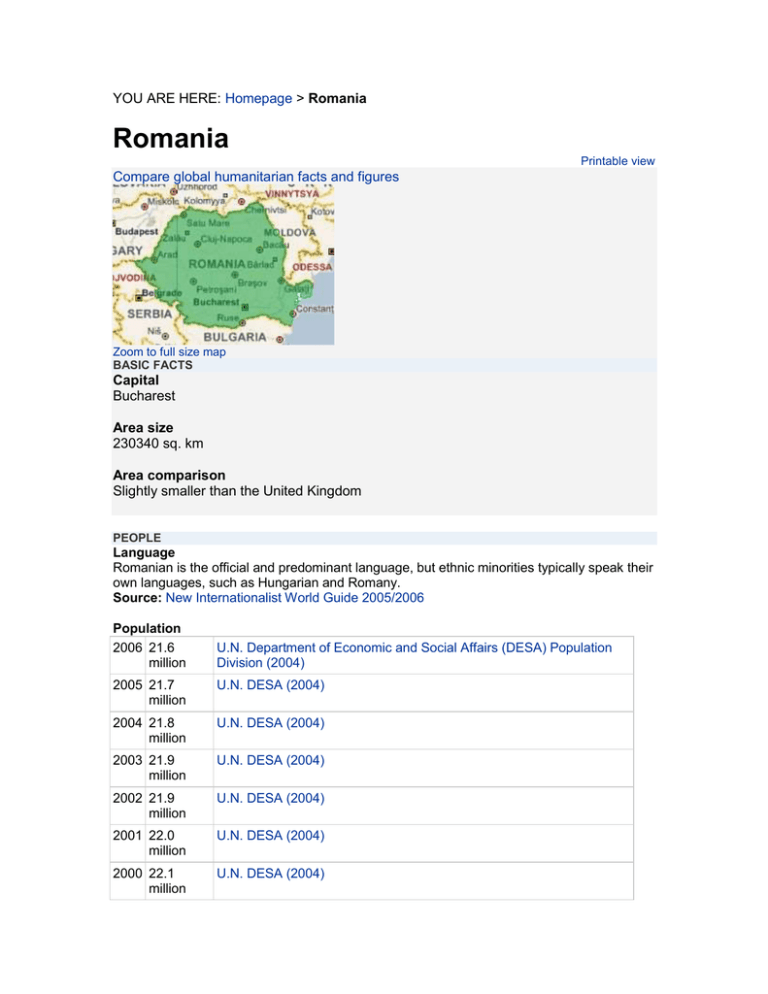
YOU ARE HERE: Homepage > Romania Romania Printable view Compare global humanitarian facts and figures Zoom to full size map BASIC FACTS Capital Bucharest Area size 230340 sq. km Area comparison Slightly smaller than the United Kingdom PEOPLE Language Romanian is the official and predominant language, but ethnic minorities typically speak their own languages, such as Hungarian and Romany. Source: New Internationalist World Guide 2005/2006 Population 2006 21.6 million U.N. Department of Economic and Social Affairs (DESA) Population Division (2004) 2005 21.7 million U.N. DESA (2004) 2004 21.8 million U.N. DESA (2004) 2003 21.9 million U.N. DESA (2004) 2002 21.9 million U.N. DESA (2004) 2001 22.0 million U.N. DESA (2004) 2000 22.1 million U.N. DESA (2004) Future population estimates 16.8 million (2050) Source: U.N. DESA (2004) Ethnic groups Romanian 90 percent, ethnic Hungarian seven percent; these data do not include the Roma, who represent five to 10 percent of the population but are usually considered Romanian under the census. There are smaller German, Ukrainian and other minorities. Source: NI World Guide 2005/2006 Religion Predominantly Romanian Orthodox (87 percent), with Roman Catholic (five percent) and Protestant (3.5 percent) minorities. Source: NI World Guide 2005/2006 Percentage urban population 2007 54.0 percent U.N. DESA - World Urbanisation Prospects 2005</< td> 2006 53.8 percent U.N. DESA (2005) 2005 53.7 percent U.N. DESA (2005) 2004 53.5 percent U.N. DESA (2005) 2003 53.4 percent U.N. DESA (2005) 2002 53.3 percent U.N. DESA (2005) 2001 54.6 percent U.N. DESA (2005) 2000 54.6 percent U.N. DESA (2005) Year women granted right to vote 1929 1946 Source: U.N. Development Programme (UNDP) Human Development Report Where two figures are shown, the first refers to a partial recognition of the right to vote and the second to the year women received the right to vote on a universal and equal basis. Net percentage of girls enrolled in primary education 88 (2002-2003) Source: UNDP - Human Development Report 2005 Percentage of population under 15 2004 15.9 percent UNDP - Human Development Report 2006 2003 16.5 percent UNDP - Human Development Report 2005 2002 17.1 percent UNDP - Human Development Report 2004 2001 17.7 percent UNDP - Human Development Report 2003 2000 18.3 percent UNDP - Human Development Report 2002 USEFUL INFORMATION Time zone Standard Time GMT +2, Summer Time GMT +3 Climate description Continental, cold, snowy winters and hot summers Currency Lei Telephone dialling code (+) 40 Driving (left/right) Right STANDARD OF LIVING Average life expectancy 2004 71.5 years UNDP - Human Development Report 2006 2003 71.3 years UNDP - Human Development Report 2005 2002 70.5 years UNDP - Human Development Report 2004 2001 70.5 years UNDP - Human Development Report 2003 2000 69.8 years UNDP - Human Development Report 2002 Life expectancy - male 2004 68.0 years UNDP - Human Development Report 2006 2003 67.8 years UNDP - Human Development Report 2005 2002 67.0 years UNDP - Human Development Report 2004 2001 67.0 years UNDP - Human Development Report 2003 2000 66.5 years UNDP - Human Development Report 2002 Life expectancy - female 2004 75.2 years UNDP - Human Development Report 2006 2003 75.0 years UNDP - Human Development Report 2005 2002 74.2 years UNDP - Human Development Report 2004 2001 74.2 years UNDP - Human Development Report 2003 2000 73.3 years UNDP - Human Development Report 2002 Infant mortality 2005 16 per 1,000 live births U.N. Children's Fund (UNICEF) - State of the World's Children 2007</< td> 2004 17 per 1,000 live births UNICEF - State of the World's Children 2006 2003 18 per 1,000 live births UNDP - Human Development Report 2005 2002 19 per 1,000 live UNDP - Human Development Report 2004 births 2001 19 per 1,000 live births UNDP - Human Development Report 2003 2000 19 per 1,000 live births UNDP - Human Development Report 2002 Child mortality - deaths before the age of five 2005 19 per 1,000 live births UNICEF - State of the World's Children 2007 2004 20 per 1,000 live births UNICEF - State of the World's Children 2006 2003 20 per 1,000 live births UNDP - Human Development Report 2005 2002 21 per 1,000 live births UNDP - Human Development Report 2004 2001 21 per 1,000 live births UNDP - Human Development Report 2003 2000 22 per 1,000 live births UNDP - Human Development Report 2002 Births attended by skilled personnel 1996-2004 99 percent UNDP - Human Development Report 2006 1995-2003 98 percent UNDP - Human Development Report 2005 1995-2002 98 percent UNDP - Human Development Report 2004 1995-2001 98 percent UNDP - Human Development Report 2003 1995-2000 98 percent UNDP - Human Development Report 2002 Maternal mortality 49 per 100,000 live births (2000) Source: UNDP - Human Development Report 2006 Human development index (HDI rank) 2004 60 UNDP - Human Development Report 2006 2003 64 UNDP - Human Development Report 2005 2002 69 UNDP - Human Development Report 2004 2001 72 UNDP - Human Development Report 2003 2000 63 UNDP - Human Development Report 2002 Percentage of children under weight for age (under age 5) 19963 percent UNICEF - State of the World's Children 2007</< 2005 td> 19962004 No data available percent 19952003 6 percent 19952002 No data available percent UNDP - Human Development Report 2005 19952001 6 percent UNDP - Human Development Report 2003 19952000 No data available percent Percentage of undernourished population 2001-2003 <2.5 percent UNDP - Human Development Report average 2006 2000-2002 average 1 percent 1999-2001 average No data available percent 1998-2000 average No data available percent UNDP - Human Development Report 2005 Food intake falls below the minimum requirement. Population with access to improved water 2004 57 percent UNICEF and World Health Organisation (WHO) 2006 2002 57 percent UNDP - Human Development Report 2005 2000 58 percent UNDP - Human Development Report 2004 Population with access to improved sanitation 2004 No data available percent 2002 51 percent UNDP - Human Development Report 2005 2000 53 percent UNDP - Human Development Report 2004 Literacy - average 2004 97.3 percent UNDP - Human Development Report 2006 2003 97.3 percent UNDP - Human Development Report 2005 2002 97.3 percent UNDP - Human Development Report 2004 2001 98.2 percent UNDP - Human Development Report 2003 2000 98.1 percent UNDP - Human Development Report 2002 Literacy - male 2004 98.4 percent UNDP - Human Development Report 2006 2003 98.4 percent UNDP - Human Development Report 2005 2002 98.4 percent UNDP - Human Development Report 2004 2001 99.1 percent UNDP - Human Development Report 2003 2000 99.0 percent UNDP - Human Development Report 2002 Literacy - female 2004 96.3 percent UNDP - Human Development Report 2006 2003 96.3 percent UNDP - Human Development Report 2005 2002 96.3 percent UNDP - Human Development Report 2004 2001 97.4 percent UNDP - Human Development Report 2003 2000 97.3 percent UNDP - Human Development Report 2002 Landlines telephones 2005 202 per 1,000 people International Telecommunication Union (ITU) 2006 2004 203 per 1,000 people ITU 2006 2003 200 per 1,000 people ITU 2006 2002 193 per 1,000 people ITU 2006 2001 184 per 1,000 people ITU 2006 2000 174 per 1,000 people ITU 2006 Cellular telephone subscribers 2005 615 per 1,000 people ITU 2006 2004 471 per 1,000 people ITU 2006 2003 325 per 1,000 people ITU 2006 2002 235 per 1,000 people ITU 2006 2001 172 per 1,000 people ITU 2006 2000 111 per 1,000 people ITU 2006 Internet users 2005 208 per 1,000 people ITU 2006 2004 208 per 1,000 people ITU 2006 2003 185 per 1,000 people ITU 2006 2002 101 per 1,000 people ITU 2006 2001 45 per 1,000 people ITU 2006 2000 36 per 1,000 people ITU 2006 Transparency International corruption ranking (1=least corrupt, 145=most corrupt) 2006 84 (joint) Transparency International 2005 85 (joint) Transparency International 2004 87 (joint) Transparency International 2003 83 (joint) Transparency International 2002 77 (joint) Transparency International 2001 69 (joint) Transparency International 2000 68 Transparency International Signatory of International Convention on the Prevention and Punishment for the crime of Genocide Yes (1948) Source: UNDP - Human Development Report Signatory of the Convention against Torture and Other Cruel, Inhuman or Degrading Treatment or Punishment Yes (1984) Source: UNDP - Human Development Report Signatory of the Convention on the Rights of the Child Yes (1989) Source: UNDP - Human Development Report ECONOMY & AID Percentage of population living on less than US$1 a day 1990-2004 No data available percent 1990-2002 No data available percent 1990-2001 2.1 percent UNDP - Human Development Report 2003 GNI per capita, Atlas method 2005 3830 current US$ World Bank Data Profile Tables 2006 2004 2950 current US$ World Bank Data Profile Tables 2006 2003 2290 current US$ World Bank Data Profile Tables 2006 2002 1930 current US$ World Bank Data Profile Tables 2006 2001 1750 current US$ World Bank Data Profile Tables 2006 2000 1690 current US$ World Bank Data Profile Tables 2006 The purpose of the Atlas conversion factor is to reduce the impact of exchange rate fluctuations in a cross-country comparison of national incomes. The Atlas conversion factor for any year is the average of a country?s exchange rate (or alternative conversion factor) for that year and its exchange rates for the two preceding years. GDP 2005 98.6 current US$ billions World Bank Data Profile Tables 2006 2004 75.5 current US$ billions World Bank Data Profile Tables 2006 2003 59.5 current US$ billions World Bank Data Profile Tables 2006 2002 45.8 current US$ billions World Bank Data Profile Tables 2006 2001 40.2 current US$ billions World Bank Data Profile Tables 2006 2000 37.1 current US$ billions World Bank Data Profile Tables 2006 Annual GDP growth 2005 4.1 percent World Bank Data Profile Tables 2006 2004 8.4 percent World Bank Data Profile Tables 2006 2003 5.2 percent World Bank Data Profile Tables 2006 2002 5.1 percent World Bank Data Profile Tables 2006 2001 5.7 percent World Bank Data Profile Tables 2006 2000 2.1 percent World Bank Data Profile Tables 2006 Annual inflation 2005 12.0 percent World Bank Data Profile Tables 2006 2004 15.0 percent World Bank Data Profile Tables 2006 2003 19.4 percent World Bank Data Profile Tables 2006 2002 23.4 percent World Bank Data Profile Tables 2006 2001 37.4 percent World Bank Data Profile Tables 2006 2000 44.3 percent World Bank Data Profile Tables 2006 Share of income or consumption (poorest 10 percent) 3.2 (2003) Source: UNDP - Human Development Report 2005 Share of income or consumption (richest 10 percent) 26.1 (2003) Source: UNDP - Human Development Report 2005 HEALTH Physicians 1990-2004 190 per 100,000 people UNDP - Human Development Report 2006 1990-2003 189 per 100,000 people UNDP - Human Development Report 2004 1990-2002 191 per 100,000 people UNDP - Human Development Report 2003 Percentage HIV+ (adults aged 15-49) 2005 <0.1 percent U.N. Programme on HIV and AIDS (UNAIDS) 2006 2003 No data available percent Malaria No risk Source: WHO TB cases 2004 146 per 100,000 people WHO 2006 2003 146 per 100,000 people WHO 2006 2002 145 per 100,000 people WHO 2006 2001 143 per 100,000 people WHO 2006 2000 136 per 100,000 people WHO 2006 CONFLICT & MIGRATION Number of refugees originating here 2005 11492 Office of the U.N. High Commissioner for Refugees (UNHCR) 2004 5916 UNHCR 2003 8387 UNHCR 2002 8847 UNHCR 2001 6052 UNHCR 2000 7348 UNHCR Number of refugees residing here 2005 2056 UNHCR 2004 1627 UNHCR 2003 2011 UNHCR 2002 1857 UNHCR 2001 1805 UNHCR 2000 1685 UNHCR Number of internally displaced people\Estimate No data available Landmine casualties per year 2004 0 Landmine Monitor Report 2005 2003 0 Landmine Monitor Report 2004 Casualty figures may include both civilians and military personnel injured or killed by landmines and unexploded ordnance. Signatory to landmine convention? Yes (1997 ) Source: Landmine Monitor Report Percentage of GDP spent on military 2004 2.1 percent UNDP - Human Development Report 2006 2003 2.4 percent UNDP - Human Development Report 2005 2002 2.3 percent UNDP - Human Development Report 2004 2001 2.5 percent UNDP - Human Development Report 2003 2000 2.1 percent UNDP - Human Development Report 2002 Percentage of GDP spent on education 2000-2002 3.5 percent UNDP - Human Development Report 2005 1999-2001 3.5 percent UNDP - Human Development Report 2004 1998-2000 3.5 percent UNDP - Human Development Report 2003 Percentage of GDP spent on health 2002 4.2 percent UNDP - Human Development Report 2005 2001 5.2 percent UNDP - Human Development Report 2004 2000 1.9 percent UNDP - Human Development Report 2003 AlertNet makes every effort to ensure statistics are updated from the relevant sources as soon as they are available.
