Alerting humanitarians to emergencies
About AlertNet | Why join AlertNet? | Help
Russia
Printable view
Compare global humanitarian facts and figures
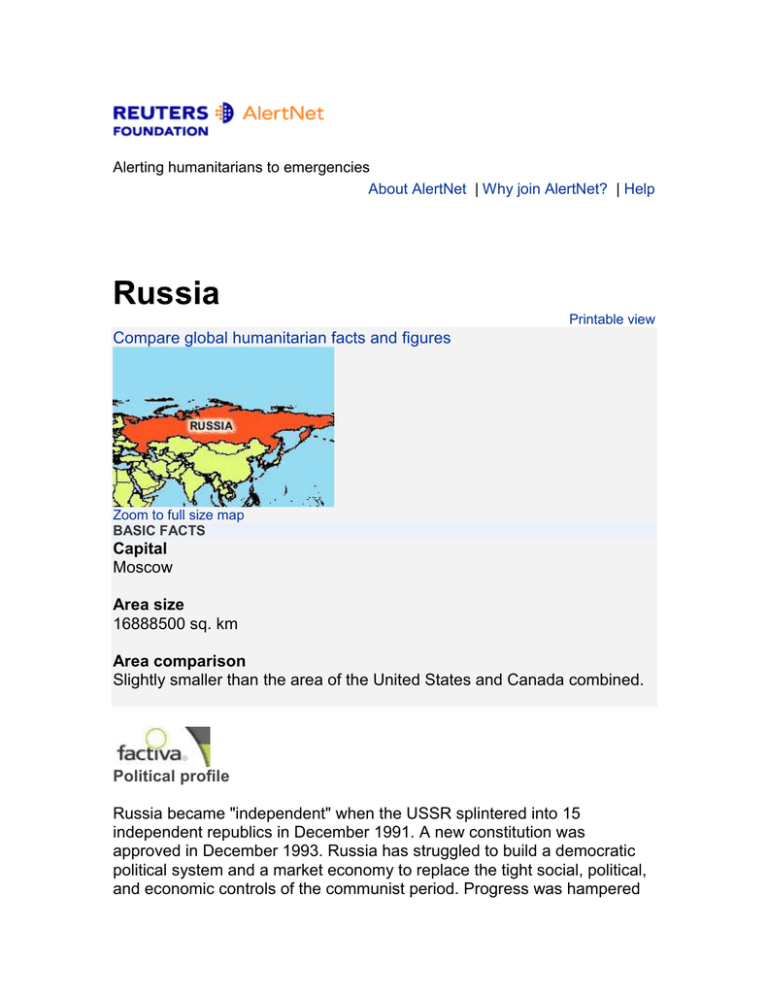
Zoom to full size map
BASIC FACTS
Capital
Moscow
Area size
16888500 sq. km
Area comparison
Slightly smaller than the area of the United States and Canada combined.
Political profile
Russia became "independent" when the USSR splintered into 15
independent republics in December 1991. A new constitution was
approved in December 1993. Russia has struggled to build a democratic
political system and a market economy to replace the tight social, political,
and economic controls of the communist period. Progress was hampered
by the financial crisis of 1998, when the rouble collapsed, and war in
Chechnya. The centre-right Unity bloc and like-minded parties won almost
a third of seats in Duma elections in December 1999. Vladimir Putin was
elected President in March 2000
and re-elected in March 2004.
The political scene is now relatively stable, underpinned by a three-year
long economic recovery. Putin has strengthened and recentralised state
powers, consolidated his own position, and presided over a significant
acceleration of economic reforms. United Russia, the party backed by
Putin, won a landslide victory in the December 2003 parliamentary
election. The Communists managed a distant second while nationalist
parties increased their representation significantly. The more liberal parties
lost almost all their seats.
Mikhail Kasyanov remained prime minister after the election but was
dismissed along with the rest of the government in February 2004 ahead of
the presidential election.
He was replaced by Mikhail Fradkov.
Putin has recently sought to buttress his domestic reform agenda with a
turn to the West in foreign policy, in the face of some domestic opposition
and unease. Following the terrorist attacks on the US in September 2001,
Putin signed Russia up as an enthusiastic member of the US-led anti-terror
coalition. However, Russia was strongly opposed to the US-led invasion of
Iraq in March 2003. Fears about NATO expansion in Eastern Europe
appear to have subsided. A hardline response to separatism and terrorism
in the Caucuses and elsewhere has strained some aspects of relations
with the USA.
Russia joined the Egmont group of Financial Intelligence Units in June
2002 and in October of the same year was removed from the FATF list of
countries and territories deemed non-cooperative in the fight against
money laundering. Russia attended a FATF session as a fully-fledged
member for the first time in October 2003. In the autumn of 2003,
President Putin intensified his crack-down on the so called "oligarchs", well
connected entrepreneurs with political muscle who rose to prominence
during the Yeltsin era. In 2004, the Russian central bank revoked the
banking licenses of two local institutions for federal money-laundering
violations. This sparked a chain of events which caused chaos in the
Russian banking community.
Last updated: 2006-06-15 15:48:00
DISPUTES & CONTROVERSIAL ISSUES
(1) unresolved conflicts over territory and status across the former Soviet Union,
e.g. Chechnya (2) disputes over sections of boundary with China (3) islands of
Etorofu, Kunashiri, and Shikotan claimed by Japan (4) Caspian Sea boundaries
not yet determined with Azerbaijan, Iran, Kazakhstan and Turkmenistan (5)
Estonian and Russian negotiators reached a technical border agreement in
December 1996 - ratification (6) draft treaty delimiting the boundary with Latvia ratification (7) Russia does not recognise the claims of any other nation on
Antarctica and reserves the right to make a claim of its own at some future date
(8) 1997 border agreement with Lithuania ? not yet ratified
PEOPLE
Language
Russian (official), many local languages
Source: New Internationalist World Guide 2005/2006
Population
2005 143.2
million
U.N. Department of Economic and Social Affairs (DESA) Population
Division (2004)
2004 142.4
million
U.N. DESA
2002 143.8
million
U.N. DESA
Future population estimates
111.8 million (2050)
Source: U.N. DESA (2004)
Ethnic groups
Russian 82 percent, Tartar four percent, Ukrainian three percent. There are over
100 other nationalities, including Bashkirs, Moldovans and Chechens.
Source: NI World Guide 2005/2006
Religion
Orthodox Christianity is the predominant religion. There are also Muslim,
Protestant and Jewish minorities.
Source: NI World Guide
Percentage urban population
2003 73.3
U.N. Development Programme (UNDP) Human Development Report
percent
2005
2002 73.3
percent
UNDP - Human Development Report 2004
Year women granted right to vote
1918
Source: UNDP - Human Development Report 2005
Where two figures are shown, the first refers to a partial recognition of the right to
vote and the second to the year women received the right to vote on a universal
and equal basis.
Net percentage of girls enrolled in primary education
90 (2002-2003)
Source: UNDP - Human Development Report 2005
Percentage of population under 15
2003
16.2 percent
UNDP - Human Development Report 2005
2002
16.5 percent
UNDP - Human Development Report 2004
USEFUL INFORMATION
Time zone
Time zones span from GMT +2 to GMT +12. Standard Time Zone GMT +3,
Summer Time GMT +4.
Climate description
Extremely varied. The central region has conditions characteristic of central and
eastern Europe, although in more extreme form. Further south, the climate is
more temperate and in the northern areas of Russia and in much of Siberia the
climate is severe, with Arctic winters and short, hot summers. Only the northern
fringe is under the polar ice-cap. The far eastern region combines the extreme
temperatures of Siberia with Asiatic monsoon-type conditions, but moderated by
the mountain ranges on the Pacific coast.
Currency
Rouble
Telephone dialling code
(+) 7
Driving (left/right)
Right
STANDARD OF LIVING
Average life expectancy
2003
65.3 years
UNDP - Human Development Report 2005
2002
66.7 years
UNDP - Human Development Report 2004
Life expectancy - male
2003
59.0 years
UNDP - Human Development Report 2005
2002
UNDP - Human Development Report 2004
60.7 years
Life expectancy - female
2003
72.1 years
UNDP - Human Development Report 2005
2002
73.0 years
UNDP - Human Development Report 2004
Infant mortality
2003 16 per 1,000 live births
UNDP - Human Development Report 2005
2002
UNDP - Human Development Report 2004
18 per 1,000 live births
Child mortality - deaths before the age of five
2003 21 per 1,000 live births
UNDP - Human Development Report 2005
2002
21 per 1,000 live births
UNDP - Human Development Report 2004
Births attended by skilled personnel
99 percent (1995-2003 )
Source: UNDP - Human Development Report 2005
Maternal mortality
67 per 100,000 live births (2000)
Source: UNDP - Human Development Report 2005
Human development index (HDI rank)
2005
62
UNDP - Human Development Report 2005
2004
57
UNDP - Human Development Report 2004
Percentage of children under weight for age (under age 5)
3 percent (1995-2003 )
Source: UNDP - Human Development Report 2005
Percentage of undernourished population
4 percent (2000-2002 average)
Source: UNDP - Human Development Report 2005
Population with access to improved water
2002
96 percent
UNDP - Human Development Report 2005
2000
99 percent
UNDP - Human Development Report 2004
Population with access to improved sanitation
2002 87 percent
UNDP - Human Development Report 2005
2000
No data available percent
Literacy - average
2003
99.4 percent
UNDP - Human Development Report 2005
2002
99.6 percent
UNDP - Human Development Report 2004
Literacy - male
2003
99.7 percent
UNDP - Human Development Report 2005
2002
99.7 percent
UNDP - Human Development Report 2004
Literacy - female
2003
99.2 percent
UNDP - Human Development Report 2005
2002
UNDP - Human Development Report 2004
99.5 percent
Landlines telephones
2005 279 per 1,000 people
International Telecommunication Union (ITU) 2006
2004 275 per 1,000 people
ITU 2005
2003 253 per 1,000 people
UNDP - Human Development Report 2005
2002 242 per 1,000 people
UNDP - Human Development Report 2004
Cellular telephone subscribers
2005 836 per 1,000 people
ITU 2006
2004
516 per 1,000 people
ITU 2005
2003
249 per 1,000 people
UNDP - Human Development Report 2005
Internet users
2004 111 per 1,000 people
ITU 2005
2003
68 per 1,000 people
ITU 2004
2002
40.9 per 1,000 people
UNDP - Human Development Report 2004
Transparency International corruption ranking (1=least corrupt, 145=most
corrupt)
2005
126 (joint)
Transparency International
2004
90
Transparency International
Signatory of International Convention on the Prevention and Punishment
for the crime of Genocide
Yes (1948)
Source: UNDP - Human Development Report 2005
Signatory of the Convention against Torture and Other Cruel, Inhuman or
Degrading Treatment or Punishment
Yes (1984)
Source: UNDP - Human Development Report 2005
Signatory of the Convention on the Rights of the Child
Yes (1989)
Source: UNDP - Human Development Report 2005
ECONOMY & AID
Percentage of population living on less than US$1 a day
No data available percent
GNI per capita, Atlas method
2004
3400 current US$
World Bank Data Profile Tables 2006
2003
World Bank Data Profile Tables 2006
2590 current US$
The purpose of the Atlas conversion factor is to reduce the impact of exchange
rate fluctuations in a cross-country comparison of national incomes. The Atlas
conversion factor for any year is the average of a country?s exchange rate (or
alternative conversion factor) for that year and its exchange rates for the two
preceding years.
GDP
2004
581.4 current US$ billions
World Bank Data Profile Tables 2006
2003
431.5 current US$ billions
World Bank Data Profile Tables 2006
Annual GDP growth
2004
7.1 percent
World Bank Data Profile Tables 2006
2003
World Bank Data Profile Tables 2006
7.3 percent
Annual inflation
18.1 percent (2004)
Source: World Bank Data Profile Tables 2006
Share of income or consumption (poorest 10 percent)
3.3 (2003)
Source: UNDP - Human Development Report 2005
Share of income or consumption (richest 10 percent)
23.8 (2003)
Source: UNDP - Human Development Report 2005
HEALTH
Physicians
417 per 100,000 people (1990-2004 )
Source: UNDP - Human Development Report 2005
Percentage HIV+ (adults aged 15-49)
2005 1.1 percent
U.N. Programme on HIV and AIDS (UNAIDS) 2006
2003
0.9 percent
UNAIDS 2006
Malaria
No risk (2004-2005)
Source: U.N. World Health Organisation (WHO) 2005
TB cases
2004
115 per 100,000 people
WHO 2006
2003
118 per 100,000 people
WHO 2005
2002
121 per 100,000 people
WHO 2004
CONFLICT & MIGRATION
Number of refugees originating here
2005 102965 Office of the U.N. High Commissioner for Refugees (UNHCR)
2004 107903
UNHCR
2003 96417
UNHCR
Number of refugees residing here
2005
1523
UNHCR
2004
1852
UNHCR
2003
9899
UNHCR
Number of internally displaced people\Estimate
27581 - 170544 (2006)
Source: Internal Displacement Monitoring Centre (IDMC) 2006
Landmine casualties per year
2004
At least 404
Landmine Monitor Report 2005
2003
Landmine Monitor Report 2004
268
Casualty figures may include both civilians and military personnel injured or killed
by landmines and unexploded ordnance.
Signatory to landmine convention?
No
Source: Landmine Monitor Report 2005
Percentage of GDP spent on military
4.3 percent (2003)
Source: UNDP - Human Development Report 2005
Percentage of GDP spent on education
3.8 percent (2000-2002)
Source: UNDP - Human Development Report 2005
Percentage of GDP spent on health
3.5 percent (2002)
Source: UNDP - Human Development Report 2005
AlertNet makes every effort to ensure statistics are updated from the
relevant sources as soon as they are available.
© 1998-2006 Reuters Limited. All rights reserved. Republication or
redistribution of Reuters content, including by framing or similar means, is
expressly prohibited without the prior written consent of Reuters. Reuters
shall not be liable for any errors or delays in the content, or for any actions
taken in reliance thereon.

