Alerting humanitarians to emergencies
About AlertNet | Why join AlertNet? | Help
Hungary
Printable view
Compare global humanitarian facts and figures
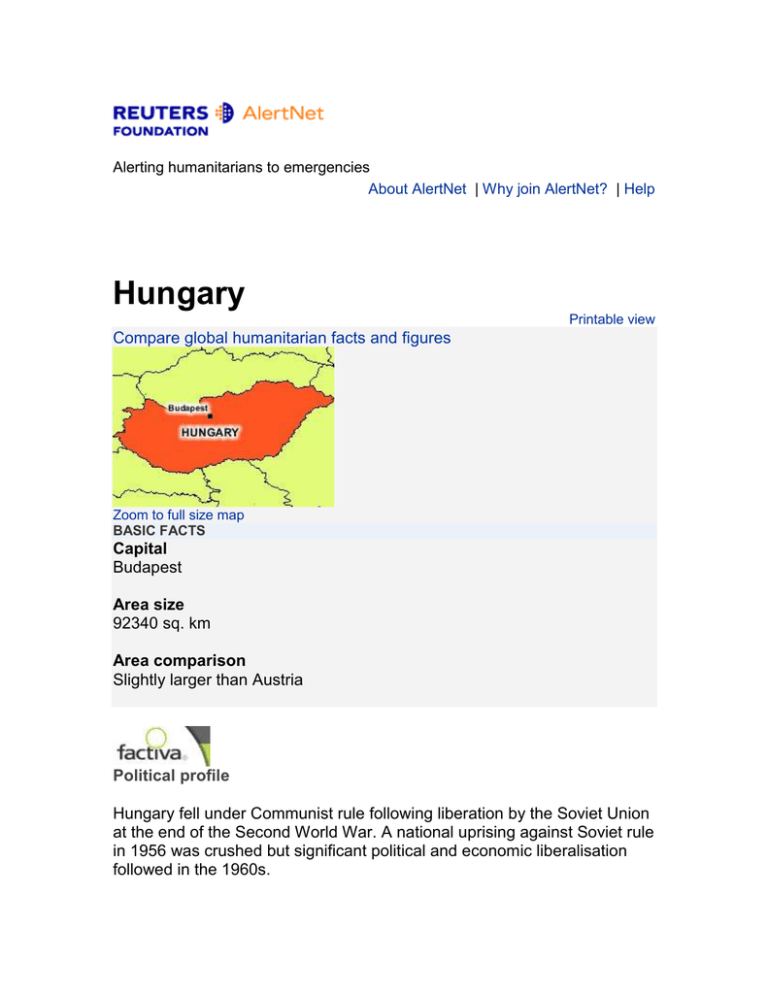
Zoom to full size map
BASIC FACTS
Capital
Budapest
Area size
92340 sq. km
Area comparison
Slightly larger than Austria
Political profile
Hungary fell under Communist rule following liberation by the Soviet Union
at the end of the Second World War. A national uprising against Soviet rule
in 1956 was crushed but significant political and economic liberalisation
followed in the 1960s.
Hungary played an important part in accelerating the collapse of
Communism in the 1980s. It was the first Eastern European country to
adopt aspects of the market economy while still under Communist rule.
Hungary led the movement to dissolve the Warsaw Pact and steadily
shifted towards multi-party democracy. Soviet forces withdrew in 1990.
Since the collapse of the USSR in 1991, Hungary has developed close
political and economic ties to Western Europe. It applied for full EU
membership in 1994.
Accession negotiations began in 1999 and it finally joined in May 2004. A
referendum held in April 2003 saw 83.8% voting ?Yes? on a turnout of
45.6%. Hungarians voted in elections to the European Parliament in June
2004.
Hungary joined NATO alongside Poland and the Czech Republic in March
1999, following a November 1997 referendum. Hungary was part of the
coalition which supported the US-led war to oust Iraqi President Saddam
Hussein and has deployed troops to assist reconstruction.
Hungary has still to resolve a number of problems hanging over from the
Communist era. The presence of large Hungarian minorities in
neighbouring countries continues to be a source of problems.
Normalisation of relations with Slovakia and Romania, the two neighbours
with the largest Hungarian minorities, has been a major issue.
One of the most sensitive issues in its relations with Slovakia has been the
Nagymaros/Gabč�vo Danube dam project.
Hungary continues to demonstrate strong economic growth. Foreign
ownership of and investment in Hungarian firms is widespread, and the
private sector now accounts for over 80% of GDP.
The devaluation of the forint in July 2003, higher interest rates and rapid
wage growth have fuelled inflationary pressures and weakened Hungary?s
external competitiveness. Hungary became an OECD member in 1996.
Since 1990, a two-party system has emerged. A right-wing coalition
government, consisting of the Federation of Young Democrats-Hungarian
Civic Party (Fidesz-MPP), the Hungarian Democratic Forum (MDF) and
the Smallholders' Party (FKgP), took office in June 1998, led by Prime
Minister Viktor Orban.
In May 2002, P鴥r Medgyessy became prime minister, heading a centreleft coalition government involving the socialist MSZP and the liberal
SZDSZ. Medgyessy resigned in August 2004 amidst tensions with the
SZDSZ over a cabinet reshuffle. He was succeeded by former Sports
Minister Ferenc Gyurcsany.
President Ferenc M� took office in August 2000 for a 5-year term,
succeeding ?pᤠG?. The Hungarian parliament elected L�l�lyom, the the
joint candidate of Fidesz-MPP and the MDF, as the country's new
president on 7 June 2005. He assumed the presidency on 5 August.
In 2003, the Financial Action Task Force (FATF) announced that it had
terminated formal monitoring as Hungary had ?adequately addressed all
the previously identified deficiencies? concerning money laundering.
Last updated: 2006-06-15 15:08:00
DISPUTES & CONTROVERSIAL ISSUES
(1) Gabč�vo/Nagymaros Dam dispute with Slovakia is before the International
Court of Justice.
PEOPLE
Language
Hungarian (official); German, Roma and Slovak are also spoken.
Source: New Internationalist World Guide 2005/2006
Population
2005 10.1
million
U.N. Department of Economic and Social Affairs (DESA) Population
Division (2004)
2004 9.8 million U.N. DESA
2002 9.9 million U.N. DESA
Future population estimates
8.3 million (2050)
Source: U.N. DESA (2004)
Ethnic groups
Ethnic Hungarians make up 92 percent of the population. There are also
Croatian, German, Roma, Romanian and other minorities.
Source: NI World Guide 2005/2006
Religion
Catholic 58 percent, Protestant 22 percent, no religion 19 percent
Source: NI World Guide 2005/2006
Percentage urban population
2003 65.2
U.N. Development Programme (UNDP) Human Development Report
percent
2005
2002 64.7
percent
UNDP - Human Development Report 2004
Year women granted right to vote
1918
Source: UNDP - Human Development Report 2005
Where two figures are shown, the first refers to a partial recognition of the right to
vote and the second to the year women received the right to vote on a universal
and equal basis.
Net percentage of girls enrolled in primary education
90 (2002-2003)
Source: UNDP - Human Development Report 2005
Percentage of population under 15
2003
16.2 percent
UNDP - Human Development Report 2005
2002
16.4 percent
UNDP - Human Development Report 2004
USEFUL INFORMATION
Time zone
Standard Time GMT +1, Summer Time GMT+2
Climate description
Continental with hot summers and cold winters; most rainfall in spring and early
summer.
Currency
Forint
Telephone dialling code
(+) 36
Driving (left/right)
Right
STANDARD OF LIVING
Average life expectancy
2003
72.7 years
UNDP - Human Development Report 2005
2002
71.9 years
UNDP - Human Development Report 2004
Life expectancy - male
68.6 years (2003)
Source: UNDP - Human Development Report 2005
Life expectancy - female
76.8 years (2003)
Source: UNDP - Human Development Report 2005
Infant mortality
2003 17 per 1,000 live births
UNDP - Human Development Report 2005
2002
UNDP - Human Development Report 2004
8 per 1,000 live births
Child mortality - deaths before the age of five
2003 8 per 1,000 live births
UNDP - Human Development Report 2005
2002
9 per 1,000 live births
UNDP - Human Development Report 2004
Births attended by skilled personnel
No data available percent
Maternal mortality
16 per 100,000 live births (2000)
Source: UNDP - Human Development Report 2005
Human development index (HDI rank)
2005
35
UNDP - Human Development Report 2005
2004
38
UNDP - Human Development Report 2004
Percentage of children under weight for age (under age 5)
1995-2003
2 percent
UNDP - Human Development Report 2005
1995-2002
2 percent
UNDP - Human Development Report 2004
Percentage of undernourished population
1 percent (2000-2002 average)
Source: UNDP - Human Development Report 2005
Population with access to improved water
2002
99 percent
UNDP - Human Development Report 2005
2000
99 percent
UNDP - Human Development Report 2004
Population with access to improved sanitation
2002
95 percent
UNDP - Human Development Report 2005
2000
99 percent
UNDP - Human Development Report 2004
Literacy - average
2003 99.3 percent
2002
UNDP - Human Development Report 2005
No data available percent
Literacy - male
2003
99.4 percent
UNDP - Human Development Report 2005
2002
99.5 percent
UNDP - Human Development Report 2004
Literacy - female
2003
99.3 percent
UNDP - Human Development Report 2005
2002
UNDP - Human Development Report 2004
99.2 percent
Landlines telephones
2005 332 per 1,000 people
International Telecommunication Union (ITU) 2006
2004 354 per 1,000 people
ITU 2005
2003 349 per 1,000 people
UNDP - Human Development Report 2005
2002 361 per 1,000 people
UNDP - Human Development Report 2004
Cellular telephone subscribers
2005 923 per 1,000 people
ITU 2006
2004
864 per 1,000 people
ITU 2005
2003
769 per 1,000 people
UNDP - Human Development Report 2005
Internet users
2004 267 per 1,000 people
ITU 2005
2003
237 per 1,000 people
ITU 2004
2002
157.6 per 1,000 people
UNDP - Human Development Report 2004
Transparency International corruption ranking (1=least corrupt, 145=most
corrupt)
2005
40 (joint)
Transparency International
2004
42
Transparency International
Signatory of International Convention on the Prevention and Punishment
for the crime of Genocide
Yes (1948)
Source: UNDP - Human Development Report 2005
Signatory of the Convention against Torture and Other Cruel, Inhuman or
Degrading Treatment or Punishment
Yes (1984)
Source: UNDP - Human Development Report 2005
Signatory of the Convention on the Rights of the Child
Yes (1989)
Source: UNDP - Human Development Report 2005
ECONOMY & AID
Percentage of population living on less than US$1 a day
No data available percent
GNI per capita, Atlas method
2004
8370 current US$
World Bank Data Profile Tables 2006
2003
World Bank Data Profile Tables 2006
6410 current US$
The purpose of the Atlas conversion factor is to reduce the impact of exchange
rate fluctuations in a cross-country comparison of national incomes. The Atlas
conversion factor for any year is the average of a country?s exchange rate (or
alternative conversion factor) for that year and its exchange rates for the two
preceding years.
GDP
2004
100.7 current US$ billions
World Bank Data Profile Tables 2006
2003
83.1 current US$ billions
World Bank Data Profile Tables 2006
Annual GDP growth
2004
4.6 percent
World Bank Data Profile Tables 2006
2003
World Bank Data Profile Tables 2006
3.4 percent
Annual inflation
4.6 percent (2004)
Source: World Bank Data Profile Tables 2006
Share of income or consumption (poorest 10 percent)
4.0 (2003)
Source: UNDP - Human Development Report 2005
Share of income or consumption (richest 10 percent)
22.2 (2003)
Source: UNDP - Human Development Report 2005
HEALTH
Physicians
316 per 100,000 people (1990-2004 )
Source: UNDP - Human Development Report 2005
Percentage HIV+ (adults aged 15-49)
2005 0.1 percent
U.N. Programme on HIV and AIDS (UNAIDS) 2006
2003
0.1 percent
UNAIDS 2006
Malaria
No risk (2004-2005)
Source: U.N. World Health Organisation (WHO) 2005
TB cases
2004
26 per 100,000 people
WHO 2006
2003
28 per 100,000 people
WHO 2005
2002
31 per 100,000 people
WHO 2004
CONFLICT & MIGRATION
Number of refugees originating here
2005 3519 Office of the U.N. High Commissioner for Refugees (UNHCR)
2004
2749
UNHCR
2003
3395
UNHCR
Number of refugees residing here
2005
8046
UNHCR
2004
7708
UNHCR
2003
7023
UNHCR
Number of internally displaced people\Estimate
No data available
Landmine casualties per year
2004
0
Landmine Monitor Report 2005
2003
1
Landmine Monitor Report 2004
Casualty figures may include both civilians and military personnel injured or killed
by landmines and unexploded ordnance.
Signatory to landmine convention?
Yes (1997)
Source: Landmine Monitor Report
Percentage of GDP spent on military
1.8 percent (2003)
Source: UNDP - Human Development Report 2005
Percentage of GDP spent on education
5.5 percent (2000-2002)
Source: UNDP - Human Development Report 2005
Percentage of GDP spent on health
5.5 percent (2002)
Source: UNDP - Human Development Report 2005
AlertNet makes every effort to ensure statistics are updated from the
relevant sources as soon as they are available.
© 1998-2006 Reuters Limited. All rights reserved. Republication or
redistribution of Reuters content, including by framing or similar means, is
expressly prohibited without the prior written consent of Reuters. Reuters
shall not be liable for any errors or delays in the content, or for any actions
taken in reliance thereon.

