Graded Assignment 1
advertisement
252grass1 9/5/05 (Open this document in 'Page Layout' view!)
Name:
Class days and time:
Please include this on what you hand in!
Graded Assignment 1
Please show your work! Neatness and whether the papers are stapled may affect your grade.
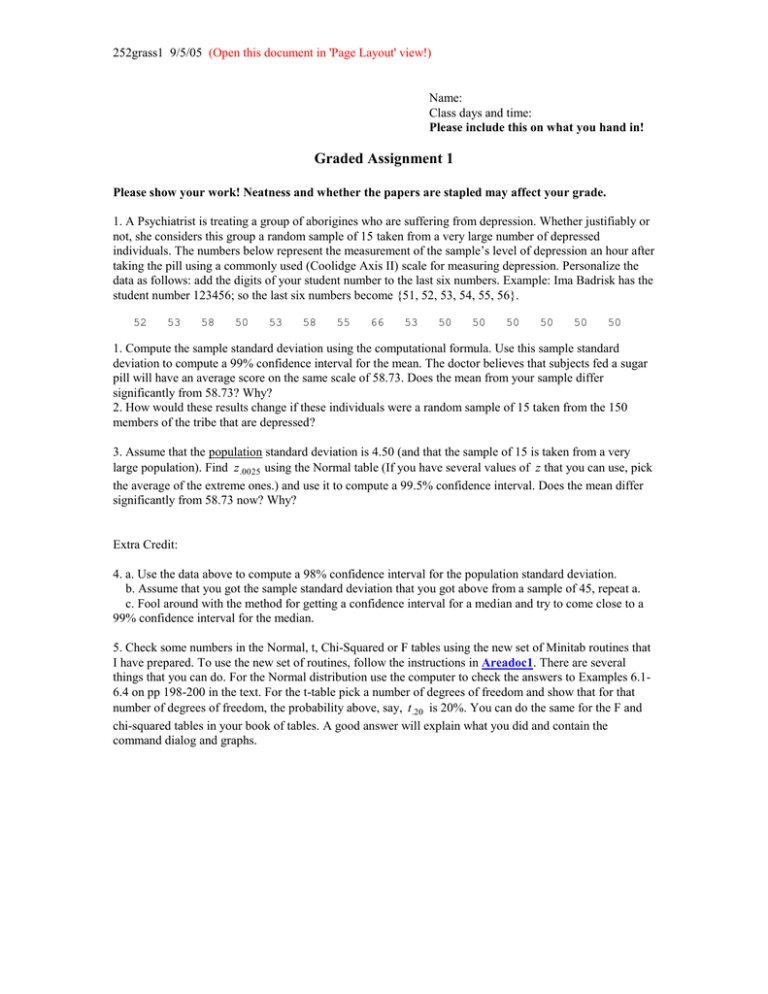
1. A Psychiatrist is treating a group of aborigines who are suffering from depression. Whether justifiably or
not, she considers this group a random sample of 15 taken from a very large number of depressed
individuals. The numbers below represent the measurement of the sample’s level of depression an hour after
taking the pill using a commonly used (Coolidge Axis II) scale for measuring depression. Personalize the
data as follows: add the digits of your student number to the last six numbers. Example: Ima Badrisk has the
student number 123456; so the last six numbers become {51, 52, 53, 54, 55, 56}.
52
53
58
50
53
58
55
66
53
50
50
50
50
50
50
1. Compute the sample standard deviation using the computational formula. Use this sample standard
deviation to compute a 99% confidence interval for the mean. The doctor believes that subjects fed a sugar
pill will have an average score on the same scale of 58.73. Does the mean from your sample differ
significantly from 58.73? Why?
2. How would these results change if these individuals were a random sample of 15 taken from the 150
members of the tribe that are depressed?
3. Assume that the population standard deviation is 4.50 (and that the sample of 15 is taken from a very
large population). Find z .0025 using the Normal table (If you have several values of z that you can use, pick
the average of the extreme ones.) and use it to compute a 99.5% confidence interval. Does the mean differ
significantly from 58.73 now? Why?
Extra Credit:
4. a. Use the data above to compute a 98% confidence interval for the population standard deviation.
b. Assume that you got the sample standard deviation that you got above from a sample of 45, repeat a.
c. Fool around with the method for getting a confidence interval for a median and try to come close to a
99% confidence interval for the median.
5. Check some numbers in the Normal, t, Chi-Squared or F tables using the new set of Minitab routines that
I have prepared. To use the new set of routines, follow the instructions in Areadoc1. There are several
things that you can do. For the Normal distribution use the computer to check the answers to Examples 6.16.4 on pp 198-200 in the text. For the t-table pick a number of degrees of freedom and show that for that
number of degrees of freedom, the probability above, say, t .20 is 20%. You can do the same for the F and
chi-squared tables in your book of tables. A good answer will explain what you did and contain the
command dialog and graphs.

